

The Observatory
The Observatory
Sequence Of Decline: Profits, Then Employment

Welcome to The Observatory. The Observatory is how we at Prometheus monitor the evolution of both the economy and financial markets in real-time. The insights provided here are slivers of our research process that are integrated algorithmically into our systems to create rules-based portfolios.
Here are the top developments that stand out to us:
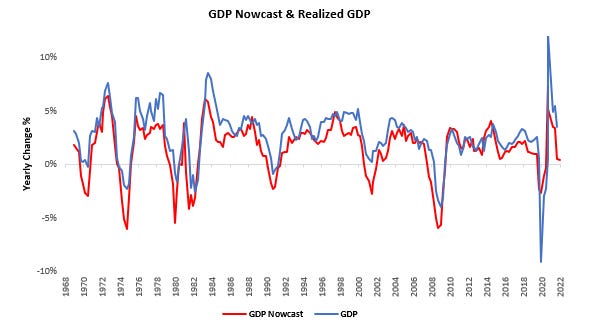
i. Labor markets are holding up US GDP growth, but the room for labor improvement continues to shrink. Our GDP Nowcast estimates real GDP growth of approximately 0.5% versus a year ago. Below, we show the Nowcast relative to realize GDP data to showcase the strong correlation:
The economy remains supported by highly tight labor markets, resulting in high nominal wage growth. Aggregate nominal wage growth is approximately 9%, but more than half of this growth comes from just three segments: Leisure & Hospitality, Education & Healthcare, & Professional & Business Services. We show this below:
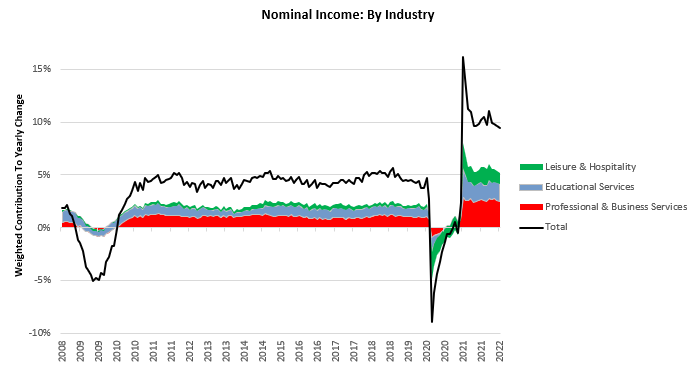
Food services, drinking places, and accommodations are the main drivers of leisure spending. Meanwhile, education remains a strong driver of wages due to the back-to-school trend. Professional and business services, including lawyers, IT employees, scientific research, and other skilled labor, remain in demand. However, the potential for these numbers to continue to accelerate is relatively low on a forward-looking basis. Below, we show the ex-ante (before the fact) odds of economic data acceleration for employee income in aggregate:
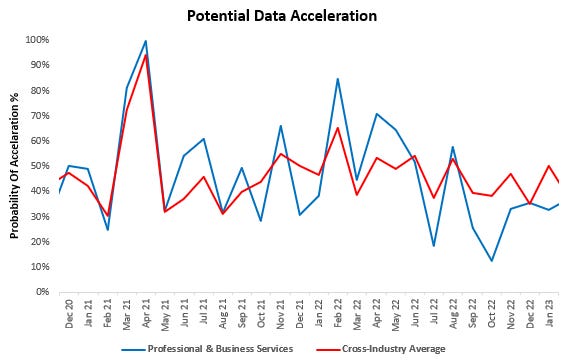
Across industries, the potential for income data (including employment and wages) remains muted. This statistical approach is supported by the extreme tightness in labor markets and the declining outlook for corporate profitability in saying that the outlook for employment growth remains bleak.
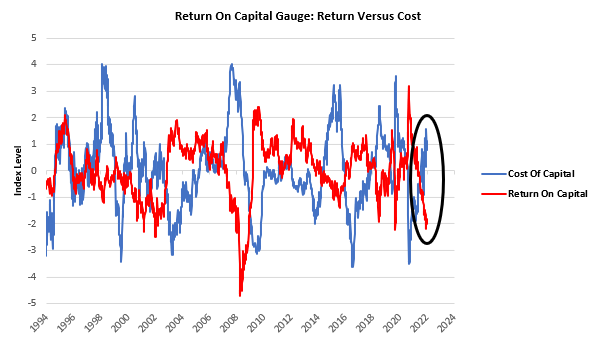
ii. The outlook for profitability continues to dwindle. Below, we show two of our proprietary gauges that estimates the shocks to the cost of capital and the return on capital in the US economy. As we highlight below, the cost of capital continues to rise with interest rates, and the return on capital continues to fall as expectations for future growth deteriorate:
This dynamic can be seen in ISM data as well, which points to deteriorating corporate profitability:
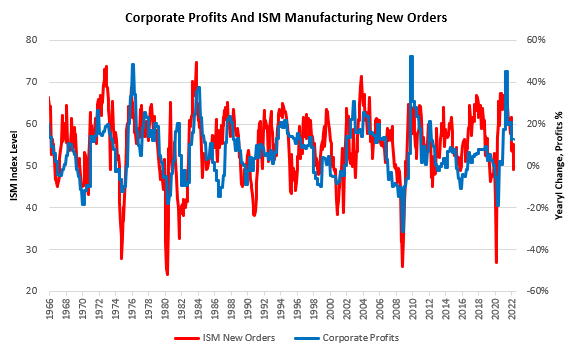
Above, we show how the new orders component of ISM manufacturing has typically allowed some insight into the state of corporate profitability. Based on this data, corporate profits would come in at approximately 3% versus the prior year. This number would be a nominal reading; therefore, real profitability is highly likely to be negative.
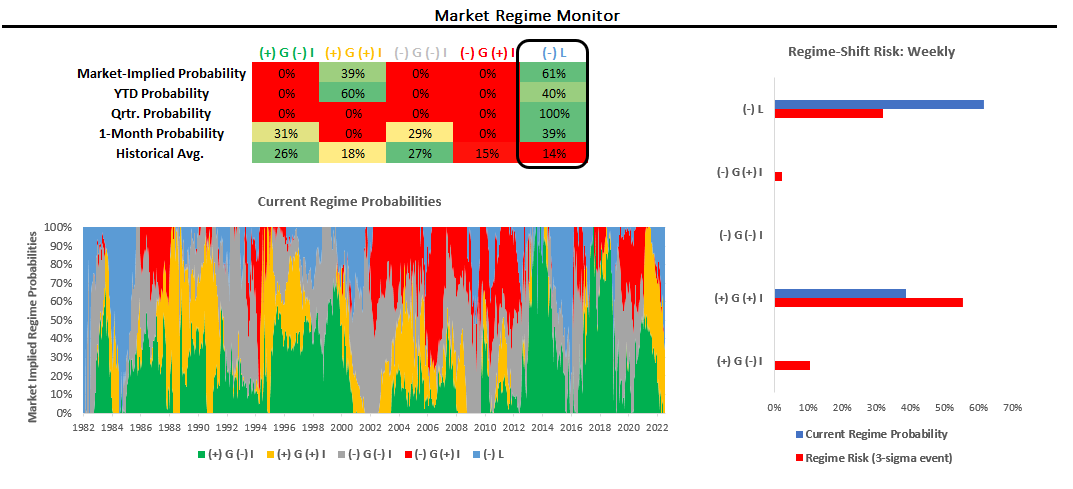
iii. Markets continue to show that we are in a tightening liquidity environment, i.e., kryptonite for all risk assets. While we have seen some whipsaw emerging in markets, i.e., increased choppiness in price action, our systems continue to tell us that markets are pricing a tightening liquidity environment.
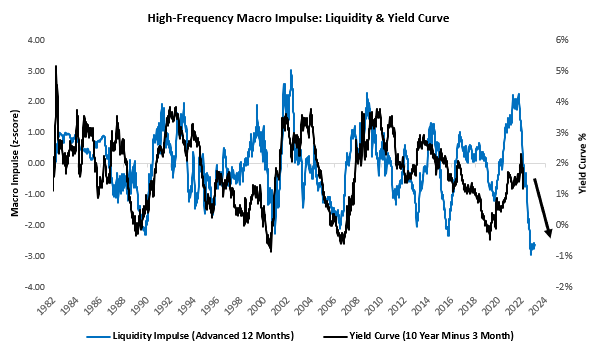
These market dynamics are consistent with what we see in the real economy, with both monetary and fiscal liquidity tightening co-occurring. Below, we show our high-frequency liquidity impulse, which typically precedes moves in the yield curve and equity valuations:
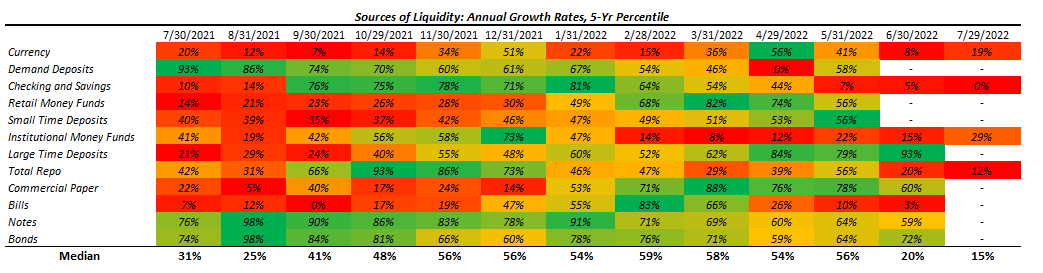
Additionally, we show how the normalized composition of the liquidity complex has evolved over the last 12 months. As we can see, conditions continue to weaken significantly:
This dynamic is unlikely to reverse until the Federal Reserve pivots on the monetary policy front. The result of this tightening dollar liquidity is a bid up in the dollar versus other currencies, and we show below in our trend monitor-which takes into account trend, volatility, correlation, and regimes-how the dollar remains the most robust risk-adjusted trend in markets:

Our systems net the signals from the above analyses and continue to point us in the same direction they have for the last few months: stay short equities & credit and long the dollar or cash. We show how our systematic Alpha Strategy is positioned at the asset class level:
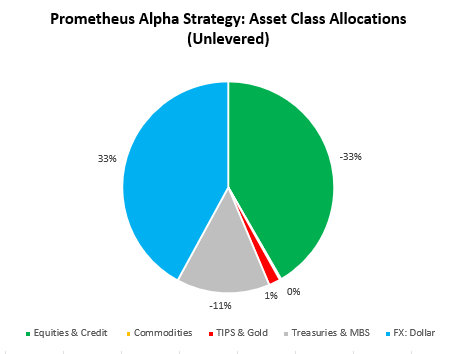
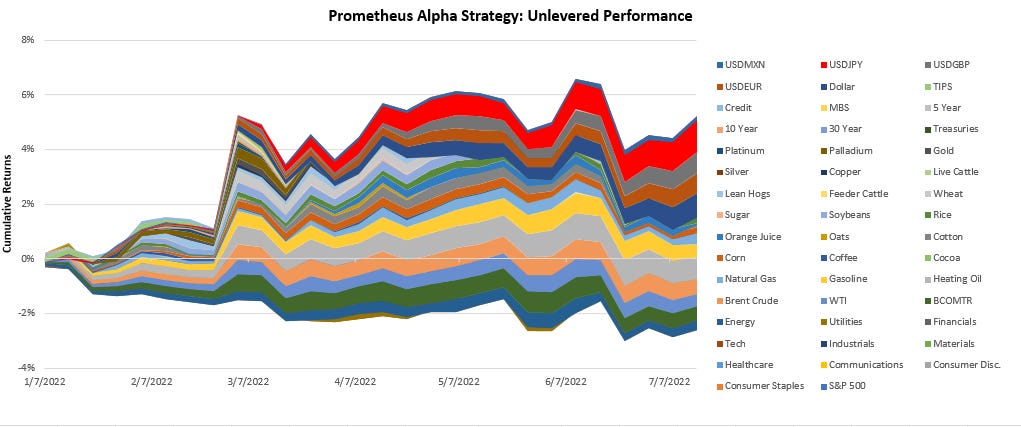
Additionally, we also have a net short treasury position. However, the systems remain long at the long-end of the Treasury curve. We show our positioning at the security level below, along with the year-to-date cumulative returns of the strategy:
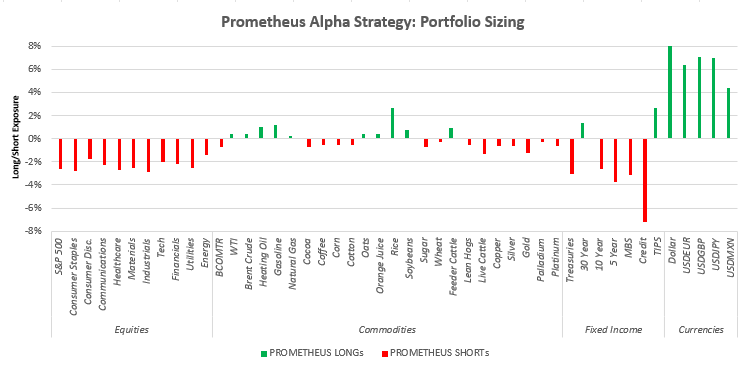
Year-to-date system returns:
Stay nimble.
Thank you for your kind words, Lucas. The portfolios are designed to target a lower level of volatility, relative to the high level of expected returns. Following this approach has typically resulted in much less volatility and losses than what is typically followed by retail investors. For instance, the S&P 500 has had drawdowns of 45% several times over the last few decades. Conversely, our strategies aim to have less than 15% drawdown even when using 2.2X leverage.
Our approach is based on knowing where you are in the economic cycle and positioning accordingly, therefore, we like to swim with the tide rather than against it. While it may be a "radical" re-thinking of how most people typically invest, it is not radical in its risk parameters.
Awesome content guys, for real. Great models and great macro assesment, couldn´t agree more with your portfolio.
thank you for sharing