

The Observatory

Click here to enter The Observatory.
The Observatory is how we systematically track the evolution of financial markets and the US economy in real-time. Without further ado, let’s dive into what our systems are telling us:
Markets:
Yesterday proved to be a strong day for our strategies, with all our Alpha positions up for the week. Beta Rotation, which is currently in Commodities, has maintained strong performance. However, this strength is an opportunity for our strategies to reduce positions, as some of these moves are outside systematic regime-expected ranges. Notably, our systems are showing signals to reduce exposure to the big movers of yesterday, i.e., Gold & Treasuries, though they remain regime-supported positions. These signals are uniform across the Treasury curve. In the Equity space, Communications shorts continue to show opportunities to add exposures, while Consumer Discretionary shorts offer opportunities to reduce exposures.
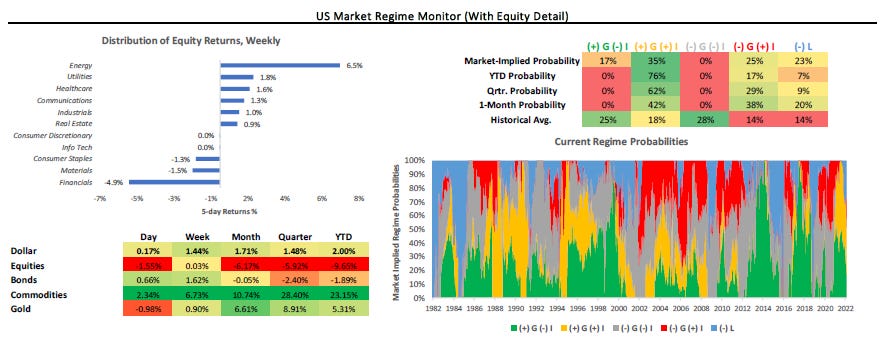
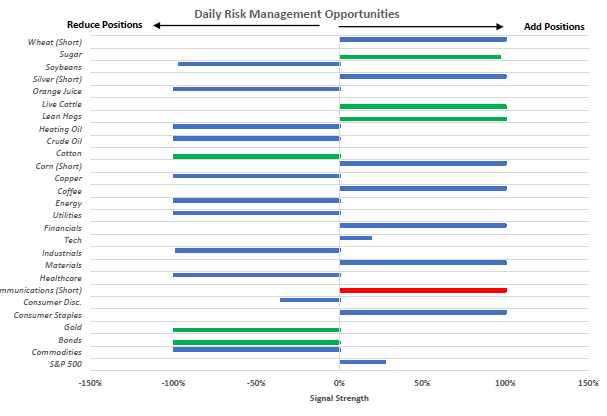
To summarize our systems' current assessment: Our Market Regime Monitors show that (+) G (+) I; has begun to seed ground to (-) G (+) I and (-) L this week. Our signals are beginning to price increasing odds of risk-off regimes. Our Momentum Monitors continue to flag that cross-asset momentum favors inflation. Gold and Commodities remain well supported during both (+) G (+) I or (-) G (+) I. Our systematic forecasts point to (-) G (+) I regime, followed by an eventual transition to (-) G (-) I. Gold would be a bridge between these regimes. Consequently, our systems tell us that the best opportunities are LONG: Bonds, Gold, Cotton, Lean Hogs, Live Cattle & Sugar, and SHORT: Communications. However, our Risk Management Monitors indicate that we can ADD to LONG: Lean Hogs, Live Cattle & Sugar, and SHORT: Communications. We can REDUCE our LONG: Bonds, Gold & Cotton. Our Expected Return Strategy is LONG: Bonds, Gold, Cotton, Lean Hogs & Sugar, and SHORT: Communications.
Macro:
Yesterday's ISM Manufacturing data came in stronger than expected, suggesting sequential strength in the US economy. However, this data should not be confused for cyclical strength, and the cyclically detrended form of ISM (and other survey data) continues to indicate a slowdown.
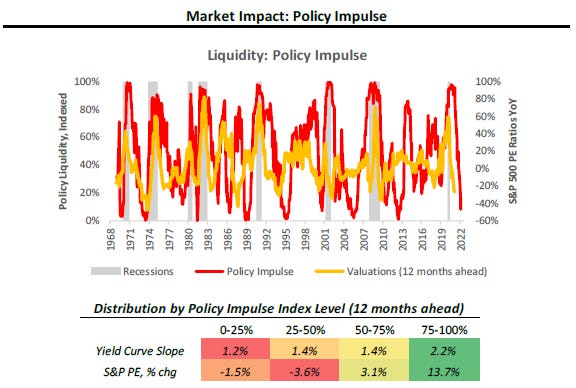
To summarize our systems' current assessment: Slowdowns from our Liquidity Indices are beginning to show themselves in Growth data. Further, the latest liquidity data and projections imply flattening yield curves, cheapening equity valuations, and higher credit spreads. Since September 2021, our systems have called for a material GDP growth slowdown in March-April 2022. Further, they estimate that CPI will slow from its currently torrid pace. These moves are highly likely and show little sensitivity to our various stress-test scenarios. However, there is likely to be a window of time during which growth falls faster than Inflation, creating a window for (-) G (+) I before an eventual transition to (-) G (-) I.
The future is dynamic, and our systems adjust as new information is available. Our bias is to allocate for the existing regime while trying to peek around the corner to what the future may hold. Finally, we optimize these views to minimize portfolio risk, resulting in our trading signals. We show all this in the document below.
Click here to enter The Observatory.