

Market Regime Views

Today, we offer updates on our economic and financial near-casts. As always, we focus on what the economic data tell us about the economy's current state, what markets tell us about expectations, and our systematic near-casting framework telling us about the near-term. Additionally, we show our Market Regime Portfolio, which applies our understanding of market-implied regimes and portfolio construction to give us a sense of the best exposures in the immediate term. Our observations are as follows:
Economic growth rates have decidedly ticked lower. Now, while GDP growth rates implied by our growth index have indeed turned lower, they are still extremely elevated, which bodes well for risk assets.
Our systematic forecast points to inflation peaking this month but staying elevated. We decompose CPI into its constituent categories and show our expected path for CPI and its subcomponents. Our discretionary analysis aligns with our systematic forecasts, leading us to think CPI will remain elevated through this year.
Liquidity conditions are starting to deteriorate. While broad liquidity points to private sector liquidity remaining abundant, there has been a significant pull-back in high-powered money, particularly USD reserves. This strengthens the case that we are heading into a declining liquidity environment.
Markets are still pricing (+) G (+) I. While we have warned that markets will eventually begin to price the deterioration in growth and inflation rates, our market-implied regime odds continue to price rising growth and inflation. Our Market Regime Portfolio continues to prefer such exposures. Additionally, we show the historical performance of this approach.
There is an increasing likelihood that (-) G (-) I (-) L will be the environment in the back half of the year. Combining our systematic forecasts for the economy and markets, our discretionary outlook for liquidity, and historical regime analysis, we programmatically estimate that the best asset class for a (-) G (-) I (-) L environment will be equities, and the worst asset class will be gold.
The future is dynamic, and our systems adjust as new information is available. Our bias is to allocate for the existing regime while trying to peek around the corner as to what the future may hold. Our Market Regime Portfolio aims to capture the current macroeconomic trend, and our systematic forecasts serve as our way of estimating what the next trend is likely to be. We discuss all this and more below.
Economic Growth: Slower, But High
Our Growth Index is our high-frequency measure of the growth impulse to GDP from a wide range of comprehensive economic data. The Growth Index has four subcomponents: risk premia, spending, production, and labor markets. The index measures economic activity at a higher frequency (monthly) and lower latency than quarterly GDP. Current economic data, which feeds the Growth Index, is currently pointing to 6.2% real GDP growth:
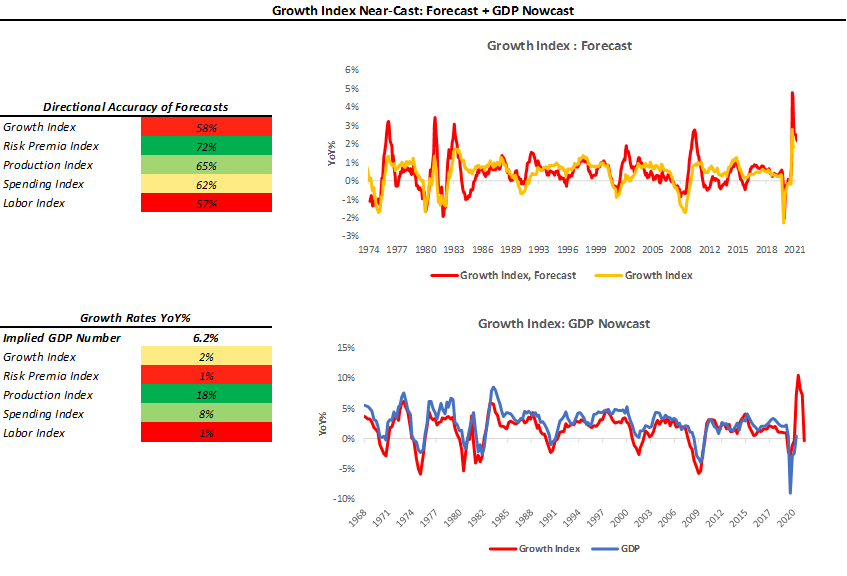
As we can see above, the Growth Index does a good job of estimating real GDP growth in real-time. The Growth Index has a directional accuracy of 88% in nowcasting real GDP growth. More importantly, unlike many regression-fitted estimates, our Growth Index actually has greater accuracy in nowcasting GDP downturns- our downside directional accuracy is 95%. When we think about our Growth Index, we prefer to focus not on the estimated magnitude of the nowcast but rather the acceleration or deceleration of the nowcast. As we can see above, our Growth Index implies GDP growth of 6.2% on a year-over-year basis, a further slowdown since our last publication where it was at 7.9%. Our systematic near casting framework points to GDP growth remaining elevated for the rest of the year. This bodes well for risk assets from a real-economic standpoint, as cashflows are likely to remain rising. However, from a market pricing perspective, this would not be as supportive as the current environment as the potential for downside surprises for data will increase as growth rates decelerate.
Inflation: Peaking This Month
Below, we show our systematic forecasts of CPI and its subcomponents. We include both a top-down estimate and a bottom-up estimate- obtained via forecasting each subcomponent. We show our CPI monitor below:
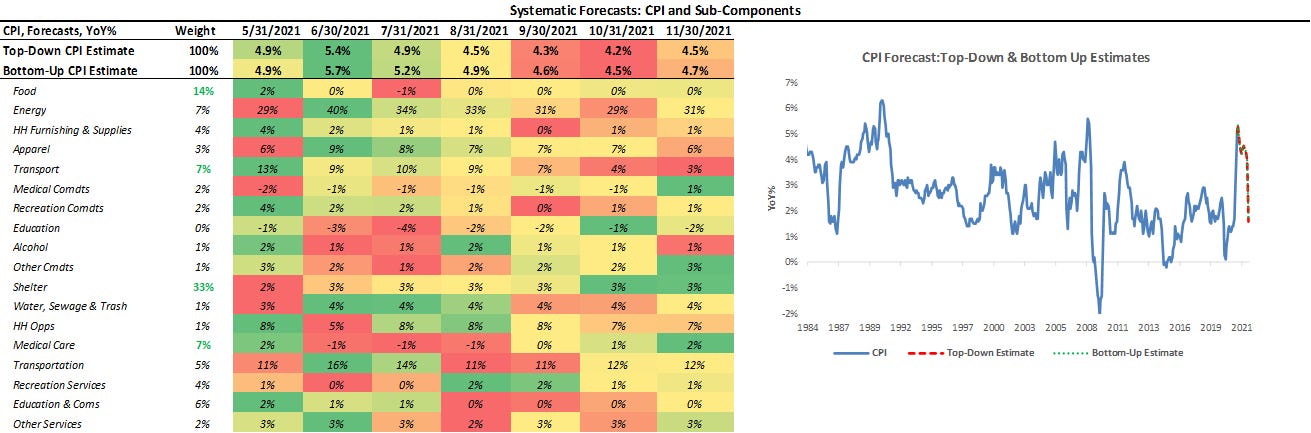
As we can see above, our top-down and bottom-up estimates concur about the future inflation trend- expecting a peak this month. Our discretionary analysis tells us that there is a chance that inflation could overshoot our systematic estimates. Our systematic forecasts are obtained using measures of trend and cyclicality to near-cast inflation. In the event inflation proves to be sticky, this could overshoot our measures of trend. Therefore, we are carefully monitoring the pervasiveness and persistence of inflation to understand current inflation's stickiness and keep you informed as the outlook evolves. The CPI numbers for July will be key in assessing the inflation trend.
Liquidity: Outlook Deteriorating
As part of our analytical framework, we assess the health of the countries’ income statement via growth and inflation and the health of its balance sheet via liquidity. Below, we show our Liquidity Monitor, where we show our measures of broad liquidity available to the private sector, along with a heatmap with its major constituents. Additionally, we show a measure of “high-powered money,” i.e., USD reserves:
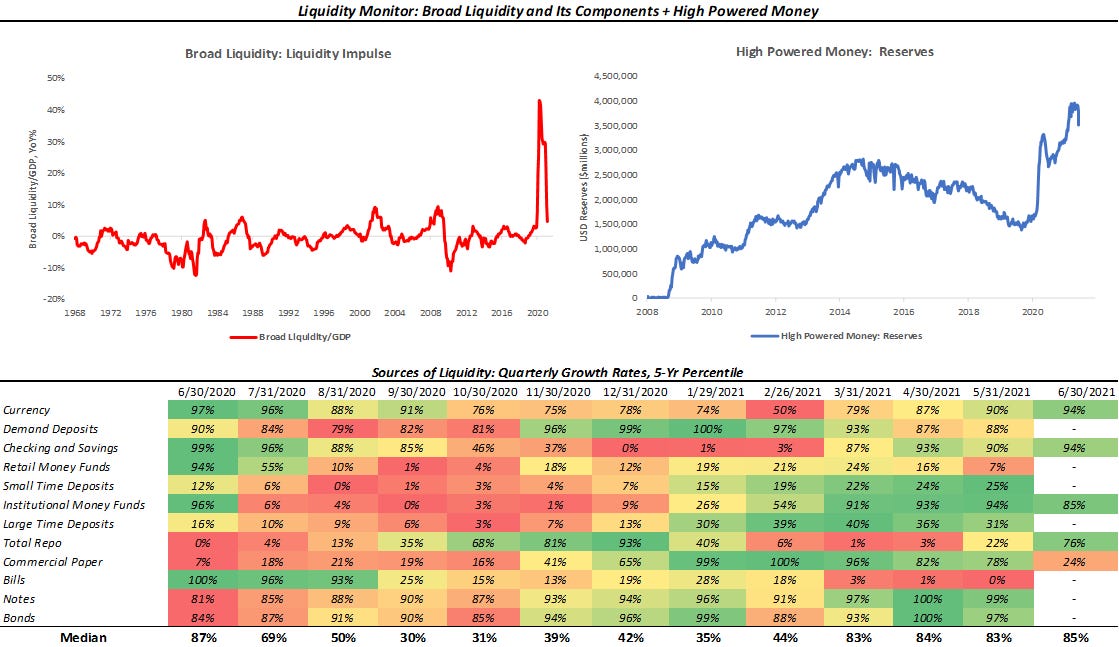
We are seeing a unique dynamic in liquidity today. While liquidity is indeed abundant today, there is a shortage of collateral to park this new liquidity- particularly due to weakness in Treasury bill issuance. As a result, massive usage of the Reserves’ Reserve Repo Facility has led to a contraction in USD reserves. Therefore, incremental QE is now simply finding its way back to the Federal Reserve via reverse repo. We expect Treasury Bill issuance to remain weak as the Treasury spends its cash balance to achieve a cash balance of $450 billion by the end of July, creating a challenging situation for liquidity. Now, while reserves don’t make up a large share of total US liquidity, they are called “high-powered money” for a reason, reserve expansion, and contraction have significant multiplier effects through the financial system. Therefore, due to the likelihood of continued reserve contraction and a potential balance sheet taper later this year, our outlook for liquidity is deteriorating.
Market-Implied Regime: (+) G (+) I
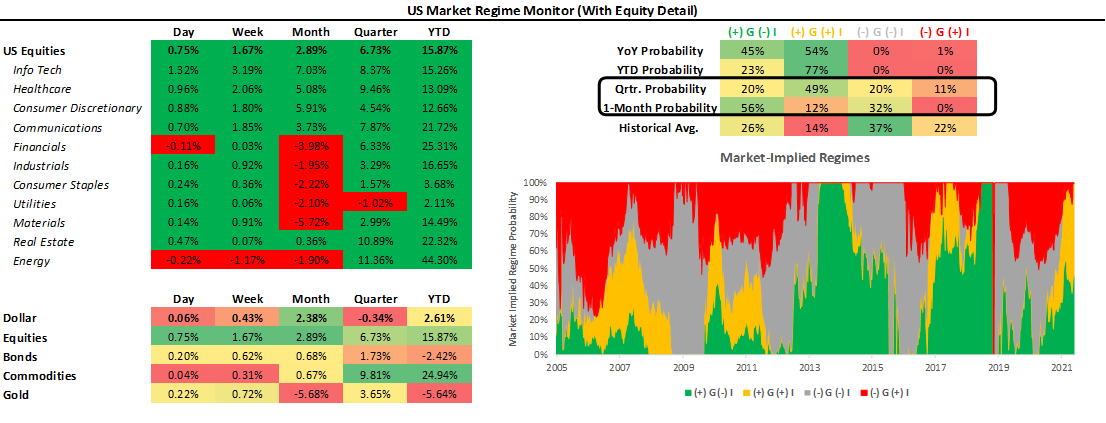
Using the performance of various asset classes, we can extract what markets are implying which particular economic regime we are in. Below, we show what markets are telling us about the current growth and inflation regime:
As we have mentioned before, we can be in one of four regimes:
(+) G (-) I: Rising Growth, Falling Inflation
(+) G (+) I: Rising Growth, Rising Inflation
(-) G (+) I: Falling Growth, Rising Inflation
(-) G (-) I: Falling Growth, Falling Inflation
Using our understanding of asset markets, we can classify periods of time into one of the four regimes mentioned above. Further, we can use the regime obtained from our market-implied odds in conjunction with measures of trend and cross-sectional momentum to create portfolio signals. To provide maximum accessibility, we truncate the portfolio construction into three stages:
Asset Class Selection: We create an asset class portfolio that selects asset class exposure based on the current market-implied regime.
Sector Rotation: We create an equity rotation portfolio that chooses sectors based on their market-regime preference- to avoid overfitting, we choose these logically rather than based on our historical regime performance.
Unlevered Portfolio: We combine Asset Class Selection and Sector Rotation.
Market Regime Portfolio: Finally, we create our Market Regime Portfolio by ex-ante targeting equity volatility, i.e., we use leverage to match equity volatility.
Below, we show the results of this process versus major asset classes. Additionally, we show the performance characteristics over the decades since the 1970s:

As we can see above, our systematic Market Regime Portfolio has a strong performance across measures and is consistent over time. The portfolio is designed to be decisive and aggressive, wholly allocating to assets that prefer the current regime, with no diversifying exposures. Therefore, we take a significant signal from our market-implied regime signal. Our current market-implied regime odds continue to point to us being in a (+) G (+) I environment, though the odds of (+) G (-) I have increased significantly as well. Currently, our systematic market-regime portfolio prefers commodities as an asset class exposure. Our systems are pointing to energy, financials, industrials, and materials at the equity sector level.
Next Regime: (-) G (-) I (-) L
While we have defined the current regime using our market-implied regime odds, we also try to peer around the corner to see what the future may hold. To do so, we combine our systematic forecasts for the economy and markets, our discretionary outlook for liquidity, and historical regime analysis to understand the prospective path of major asset classes. Based on this triangulation, we think the next environment will likely be (-) G (-) I (-) L, i.e., falling growth, inflation, and liquidity. We programmatically estimate that the best asset class for this regime will be equities, and the worst asset class will be gold. We show this below:
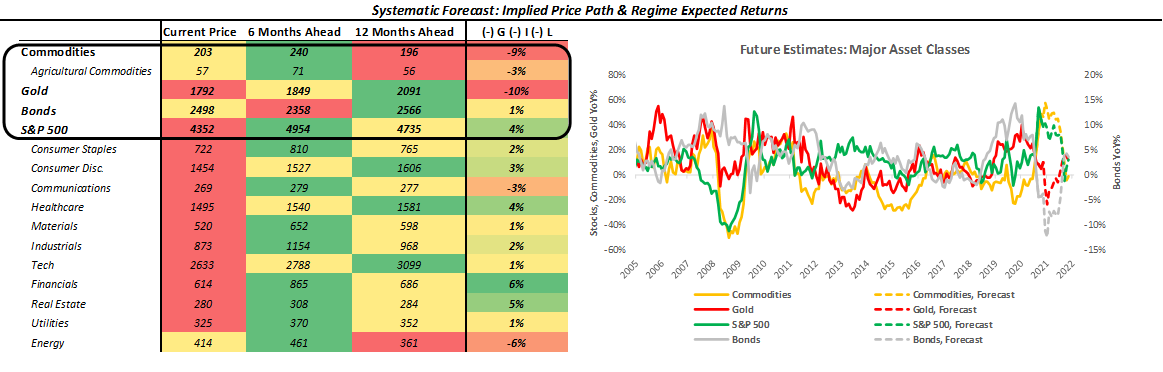
Above, we show the implied price path of various assets, which are obtained quantitatively. Then, we overlay the normalized-historical returns during the next expected economic regime defined in terms of growth, inflation, and liquidity. We combine our systematic forecasts for the economy and markets, our discretionary outlook for liquidity, and historical regime analysis to understand the prospective path of major asset classes. Based on this triangulation, we programmatically estimate that the best asset class for a (-) G (-) I (-) L environment starting September would be equities, and the worst asset class will be gold. Our programmatic selection would suggest financials, tech, consumer discretionary, industrials, and healthcare look attractive within the equity space. While indeed informative, we need to take these forecasts with a grain of salt- the future is dynamic, and transition exposure before a market regime change would not be optimal. However, these triangulated forecasts help us understand what is to come and help us prepare for an eventual transition.
Conclusions
To reiterate:
Economic growth rates have decidedly ticked lower.
Our systematic forecast points to inflation peaking this month but staying elevated.
Liquidity conditions are starting to deteriorate.
Markets are still pricing (+) G (+) I.
There is an increasing likelihood that (-) G (-) I (-) L will be the environment in the back half of the year.
Overall, growth and inflation are likely to stabilize at elevated levels relative to history, and liquidity looks set to continue normalization. Given this backdrop, markets are still pricing rising growth and inflation. Our market regime portfolio prefers commodities as an asset class exposure and energy, financials, industrials, and materials at the equity sector level. Looking ahead, if markets are to confirm our systematic forecasts of (-) G (-) I (-) L in September, then equities (financials, tech, consumer discretionary, industrials, and healthcare) look attractive, and gold does not, according to our historical regime analysis and cyclicality.
Hi, thanks for the very useful info! May I know what bonds you use in the Asset class regime table? TIA
are you able to share the excel with us?