

Gauging Consumer Spending and Saving
Gauging Consumer Spending and Saving
Can the US economy make a healthy recovery?

Going into 2021, all eyes are on the US economic recovery and whether they can justify asset valuations. Hence, at this junction, we think it is important to gauge the health of US income and its disposition. As always, we attempt to separate the signal from the noise by offering granular insights into what lies under aggregate data. The purpose of this note is to understand what is supporting and detracting from economic growth to assess where we are in economic recovery. Our findings have led us to the following conclusions:
The stock of savings in the US has reached unprecedented levels. This build-up had largely been on the back of stimulus last year. However, with stimulus expected to continue, the propensity to spend stimulus is likely to increase.
The composition of US spending continues to exhibit a pandemic theme, and there is significant variation in the economy in terms of growth. Areas of the economy have benefitted from the losses in others. However, consumers have not entirely been able to substitute certain types of spending. Hence, while we are likely to see a significant redistribution of growth in the coming months, we are also likely to see pent-up demand make its way into certain areas of the economy.
Overall, there looks to be a large stock of savings, excesses in certain parts of the economy at the expense of others, and potential for pent-up demand to be released for non-substitutable products and services. In the sections that follow, we look at these themes in-depth.
Our Approach to Income, Savings, and Spending
Personal income accounts for approximately 85% of US GDP and serves as a rich resource to mine economic insights. To obtain these insights, we dive down to the product level and recreate personal income from the bottom-up. This allows us a far more granular understanding of the economy's state than traditional aggregate analysis. At the root of our broader inferences for the economy is the dual property of accounting—one man’s expenditure is another man’s income. Hence, by understanding how people have spent their money, we can also understand how people are making money.
More practically, income is the sum of savings and consumption. We look at two components in assessing incomes: i) the balance between saving and spending and ii) the composition of spending. This allows us to develop a strong understanding of how incomes are being allocated and understand the sustainability of existing trends. In the following pages, we first look at the sustainability of high savings rates and then examine the dispersion in personal consumption expenditures.
Stimulus Has Fueled Savings, Not Spending
Last year, we saw a huge run-up in both savings rates and the stock of savings. This increase in savings rates was driven by the combination of i) a reduction in spending opportunities due to quarantines and ii) fiscal transfers. While the reduction in spending opportunities was significant, it was paired with a large shock to incomes (not including stimulus). Hence, we largely attribute the change in savings to fiscal transfers. We show this below:
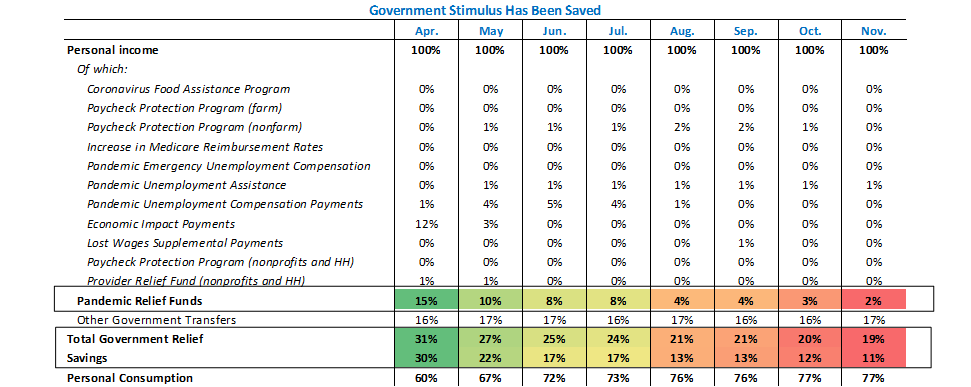
Above, we break down personal spending into its major components and show them as a share of personal income. What we notice is that there is a clear relationship between savings and total government relief— as government relief rose, so did savings. Further, we see that changes in pandemic relief funds largely drove the variation in government relief. Our inference from these numbers is that the bulk of pandemic relief went into savings, i.e., they did not meaningfully contribute to spending.
However, we question the sustainability of this dynamic in the light of an already high stock of savings. While financial media likes to focus on the flow of savings (savings rate), we take more signal from the stock of savings (total savings). Taking this perspective, we don’t see the need for consumers to continue to maintain higher savings rates, as i) they have already amassed a larger stock of savings and ii) the opportunities to spend income will increase as the US economy contains COVID-19.
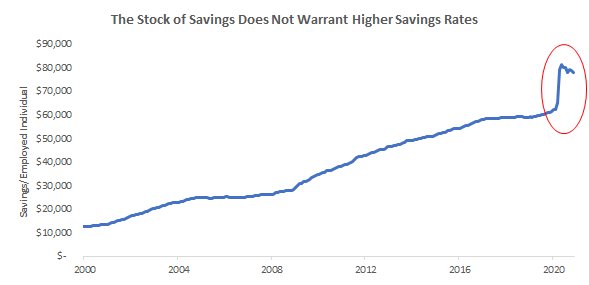
As we can see above, savings levels (normalized by the employed population) are at all-time highs. While this is partly driven by the correction in the labor market, the absolute level of savings is at a record high as well. Hence, we don’t think that the 2020 average savings rate of 16.4% will be maintained in 2021.
Further, given the high level of savings already accumulated and the prospects of continued fiscal stimulus, there is potential for savings rates to drop below pre-pandemic levels. All else being equal, this will be a support to personal consumption expenditures in 2021.
Hence, there is significant room for savings to support personal consumption expenditures. Now, while the previous chart may indicate that cash is abundant per person- we think it is important to emphasize that there can be significant variation under the surface of aggregates. There have been large divergences in economic outcomes during this pandemic. In the next section, we look at exactly this.
Segments of Spending Outperformed at the Cost of Others
As we mentioned earlier, there has been significant variation in economic outcomes during this pandemic. We show a snapshot of this below:
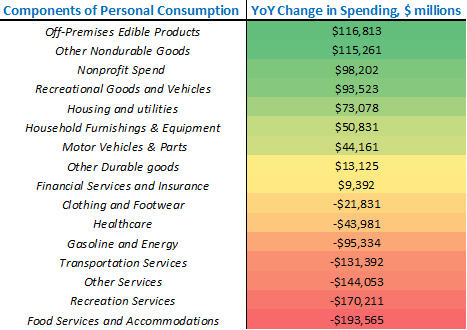
While the data is a little stale (November is the most recently available data), it allows us insight into the variation in spending aggregates. Compared to this time last year, total personal consumption expenditures were lower by $189 billion in November. There is a clear pandemic theme to the distribution of spending growth. “Stay at home” items are the best performers— edibles for off-premises consumption, recreational goods, toys, hobbies, computers, tablets, and software, etc., have gained year-over-year. On the other hand, “in-person” items are the worst performers— restaurants, hotels, motels, recreational activities and transportation services, etc. have posted significant losses.
There has been a clear trend of substitution of wants. The best performers have largely benefitted at the expense of the worst performers, as consumers attempted to substitute products that were inaccessible due to COVID-19 restrictions. This likely means that we will see a rebalancing of spending towards many of the worst performers as the economy re-opens, the aggregate effect of which will be neutral. However, there are many areas where substitution was not possible, such as sporting events, live events, transportation services, and other in-person services. Hence, while redistribution of spending might be neutral for total spending, the release of this pent-up demand for non-substitutable goods and experiences will likely support aggregate spending.
In the sections that follow, we break down the top 5 best and worst performers that comprise the year-over-year changes in personal consumption expenditures.
Edibles for Off-Premises Consumption: +$116 billion
As one may expect during a pandemic, spending on food and drink for off-premises consumption was extremely strong. This move was broad-based, and largely came at the cost of food services such as restaurants and bars.
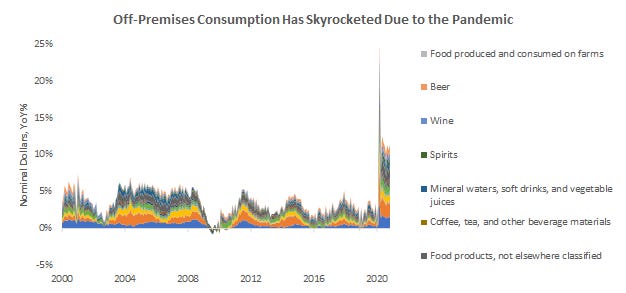
Looking forward, it is hard for us to expect such sustained levels of growth, particularly given that 2020 will be the new base of comparison. We are likely to see a moderation in this item, with gains being redistributed to food and accommodation services over the course of 2021.
Other Nondurable Goods: +$115 billion
Other Nondurable Goods consists of a group of heterogeneous goods that aren’t necessarily correlated to one another other than the fact that they can be used at home.
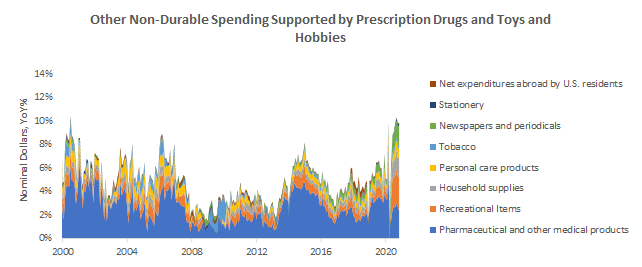
Particularly, we saw a large increase in pharmaceutical spending (prescription medication), recreation spending (toys, plants, films), household supplies, and newspapers. We could wager this was largely due to greater time spent indoors and at home as these are products typically used in those settings.
Nonprofit Spending: +$98 billion
The non-profit sector is counted in personal income accounts. This is done by subtracting payments from individuals to nonprofits from their gross output. For the sake of simplicity, we only show the gross output.
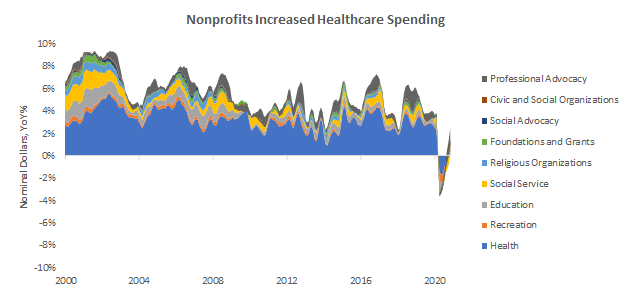
As we can see, non-profits took a hit in gross output. However, this was offset by an even larger decrease in payments from individuals. As a result, nonprofits net spending was powerful this year:
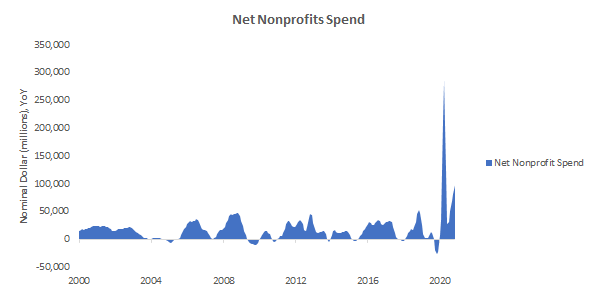
Given that a significant portion of this spending likely came from COVID-19 related healthcare services, it is unlikely that this will continue as pressures abate. Further, with the resumption of healthcare services from hospitals, it is likely that gains in this segment will be redistributed to hospitals as we progress through the year.
Recreational Goods and Vehicles: +$93 billion
As we mentioned earlier, this category of spending is dominated by technology expenditures. While this item only accounts for about 4% of total spending, its growth actually exceeds that of total spending. This mismatch is driven by the explosive growth in computers, tablets, software, and other tech accessories. As a result, recreational spending is up 20% compared to last year. This is congruent with what we are seeing in equity markets today, with technology stock driving a significant portion of gains.
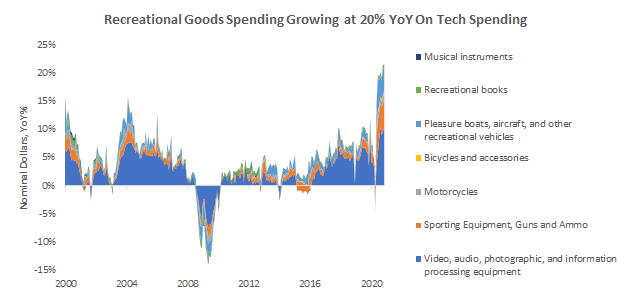
The evolution of spending items will likely play a strong role in equity pricing. After all, the majority of equity gains are now concentrated in consumer-facing, technology-related sectors.
Housing and Utilities: +$73 billion
The last major supporter of year-over-year spending is housing and utilities. However, there is an important caveat to this data, the majority of variation is determined by “owner imputed rent.”
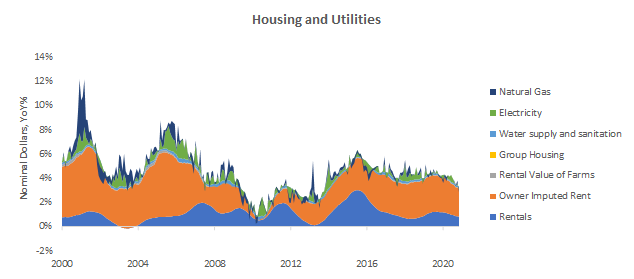
Owner Imputed Rent is essentially the rent an owner would pay for living on their own property. This number is entirely hypothetical and has more to do with the value of real estate than it does with actual payments. This means that a large component of personal expenditure is dependent on real estate prices. While the direction of real estate markets is beyond the perview of this note, we should note that real estate markets are likely to be supported by abundant liquidity and low-interest rates.
Having covered the top 5 best performers of personal consumption expenditures, it’s now time to turn to the 5 worst performers.
Food Services and Accommodations: -$192 billion
Offsetting the strength in Edibles for Off-Premises Consumption; we have significant weakness in food services and accommodations. The largest detractor from this item is a weakness in purchased meals, coming from weakness in restaurants and hotels.
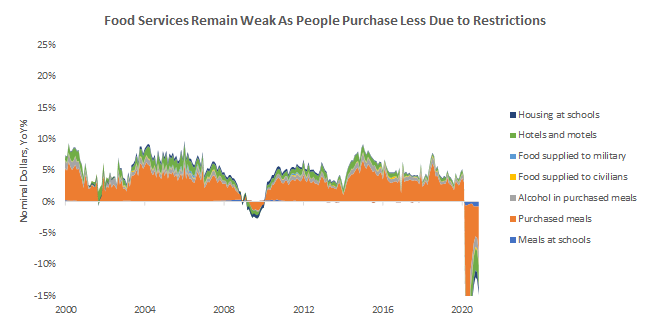
Given the trade-off between eating off-premises and on-premises- we think gains in this segment will likely come at the cost of the outperformance in edibles for off-premises consumption. Hence, there will likely be no net effect on aggregate spending, just redistribution between these two items.
Recreational Services: -$170 billion
As spending on recreational goods and hobbies that can be enjoyed at home has risen, recreational services that require in-person attendance have seen spending plummet.
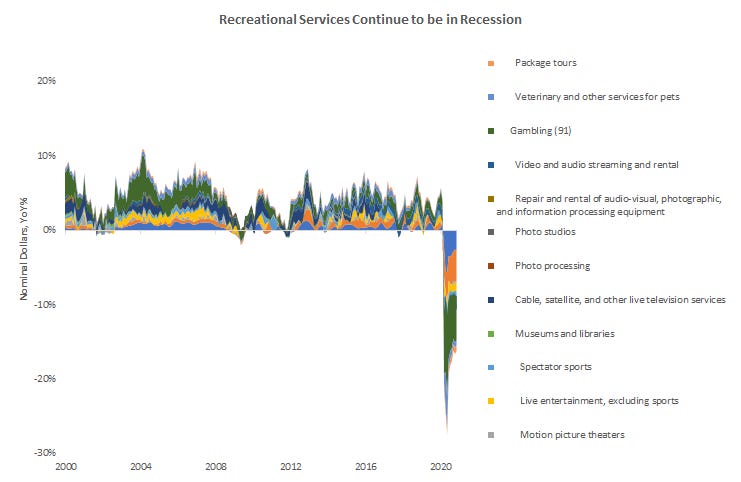
This dynamic is very similar to what we have seen in the trade-off between off-premises food consumption and food services. However, there is likely to be much more pent-up demand for recreational services as they don’t have many substitutes.
Other Services: -$144 billion
Like recreational services, other in-person services such as household maintenance, professional services, and education services remain depressed.
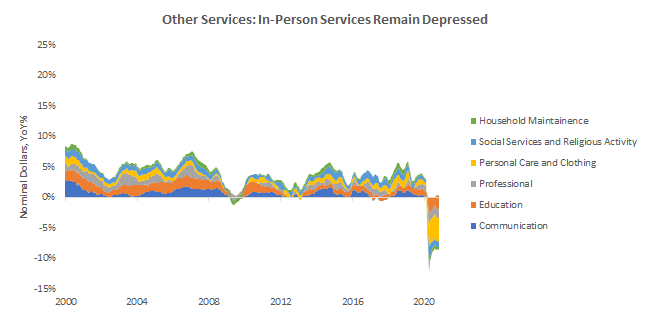
Going into 2021, this could be an area of significant strength as demand for these items cannot be satiated from other areas in the economy.
Transportation Services: -$131 billion
As one can imagine, with mobility at all-time lows, transportation services have suffered immensely.

Even a structural shift towards a work-from-home lifestyle is unlikely to keep this item as depressed as it was in 2020. Hence, this is likely to be a strong source of demand in 2021.
Gasoline and Energy: -$95 billion
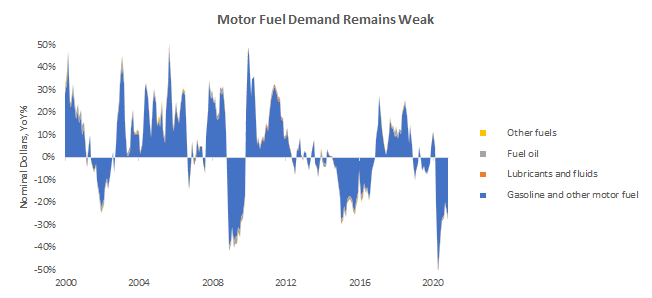
Complementing the weakness in transportation is a weakness in demand for gasoline and motor fuels. Further, given that these numbers are in nominal dollars, demand was likely lower due to significantly lower energy prices.
Conclusions
Having assessed the data, we think the US is in a good position to enjoy a strong economic recovery. Looking forward, we think that there are 3 things that will determine the health of this recovery:
Whether consumers choose to forego precautionary savings. The stock of savings is already high, requiring lower savings rates to maintain a healthy level of savings.
Certain areas of the economy are doing well at the expense of others. If we see a leveling of the playing field, we will be experiencing a far more broad-based recovery.
There is likely to be pent-up demand for certain products whose availability was limited to due to COVID-19 restrictions. As the economy re-opens, this pent-up demand will likely be released and we can expect significant growth in these areas.
Overall, we think it is the balance of these 3 factors that will determine the health of US incomes. We will continue to keep you abreast of developments on this front and shall be updating this series monthly. Until next time!
I would love to join your team! For free obviously I need to learn how to build models and what to focus on.