

Economic Regime Transition
Economic Regime Transition
Updating Our Economic & Market Views

Today, we offer updates on our economic and financial near-casts. As always, we focus on what the economic data tell us about the economy's current state, what markets tell us about expectations, and our systematic near-casting framework telling us about the near-term. Additionally, as part of our economic analysis, we present the initial versions of our Liquidity Monitor. Our observations are as follows:
Current economic data continues to point to robust growth. As a result, our Growth Index is registering peak growth rates across our Risk Premia Index, Production Index, Spending Index, and Employment Index. Additionally, our expectations of the redistribution of personal spending are unfolding on the back of large income stimulus. While the impulse from fiscal stimulus is fading
Liquidity growth remains strong and broad-based, albeit not at the pace we saw last year. Particularly, Treasury securities have shown strong growth rates over the last few months, consistent with the new monetary, fiscal regime. Given the continuation of QE and coincident fiscal expansion, we expect liquidity to remain abundant over the next few months.
Markets are increasingly beginning to price a slowing growth, rising inflation environment. As a result, since our last note, the market-implied probability of (-) G (+) I have increased to now outweigh the odds of (+) G (-) I on a year-to-date basis. We take a strong signal from this about the coming economic transition.
Our systematic forecasts are pointing to peaking economic growth rates this month. While levels of growth and inflation will remain elevated, they will likely stop rising at this time. Periods of stagnating growth and inflation have an equity allocation preference quite different from the current regime. We reiterate the lessons of history to get a better sense of our future allocation strategy.
Overall, our systems continue to point to strong growth in the near term. This is consistent with our discretionary analysis- we think that we are just starting an economic expansion with labor markets still loose, capacity underutilized, and our Liquidity Monitor point to conditions being amply accommodative. Nonetheless, the rate of acceleration of growth will fade soon, which means that there will be a significant redistribution of leadership within assets. We discuss all this and more in the pages to come.
Economic Data Is Pointing to Robust GDP Growth
Our Growth Index is our high-frequency measure of the growth impulse to GDP from a wide range of comprehensive economic data. The Growth Index has four subcomponents: risk premia, spending, production, and labor markets. The index aims to measure economic activity at a higher frequency (monthly) and lower latency than quarterly GDP. Current economic data, which feeds the Growth Index, is currently pointing to robust real GDP growth:
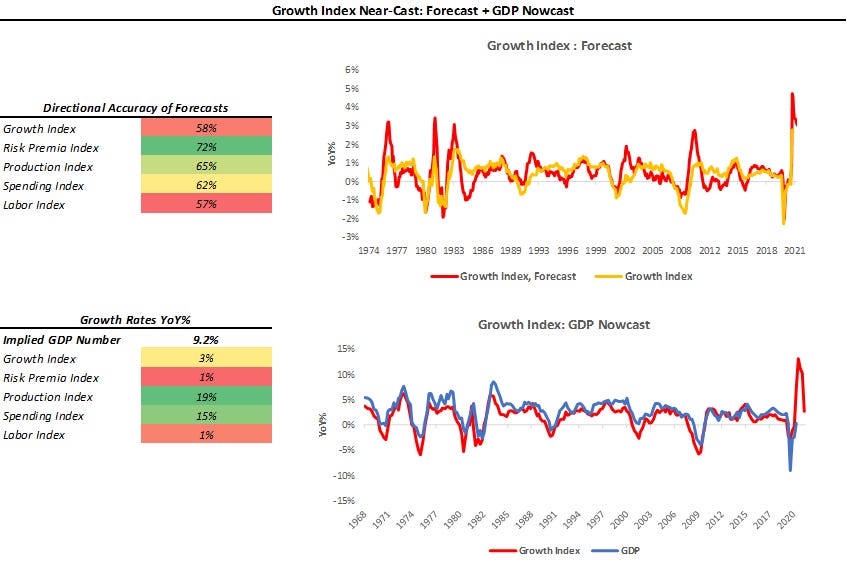
As we can see above, the Growth Index does a good job of estimating real GDP growth in real-time. The Growth Index has a directional accuracy of 88% in nowcasting real GDP growth. More importantly, unlike many regression-fitted estimates, our Growth Index actually has greater accuracy in nowcasting GDP downturns- our downside directional accuracy is 95%. When we think about our Growth Index, we prefer to focus not on the estimated magnitude of the nowcast but rather the acceleration or deceleration of the nowcast. As we can see above, the Growth Index is pointing to an extremely strong nowcast, i.e., GDP Growth will likely peak in Q2 according to our Growth Index.
Looking under the surface of the sub-indices, we isolate spending and income data to showcase major trends. The first is the ongoing redistribution in spending trends from leading sectors to laggard sectors:
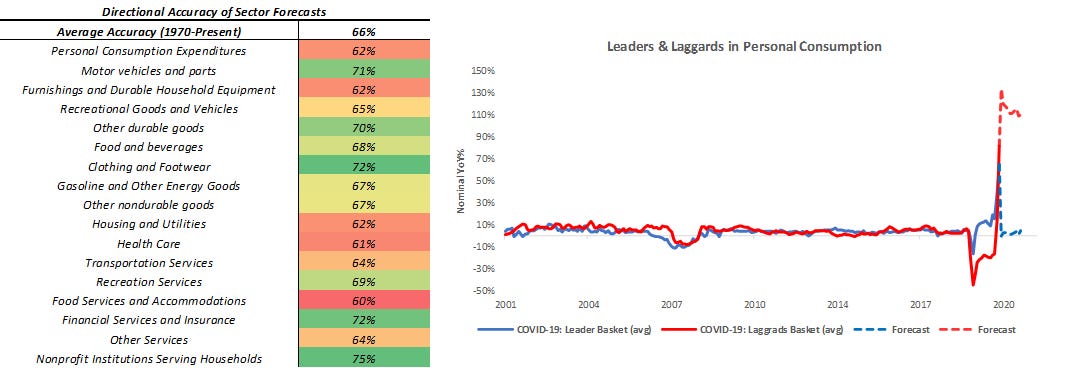
As we can see, the COVID-19 Laggard Basket is significantly outperforming the COVID-19 Leader Basket, consistent with both our systematic and discretionary analysis over the last few months. Moreover, this redistribution has come on the back of economic reopening and income stimulus, both of which have elevated incomes. We show this below:
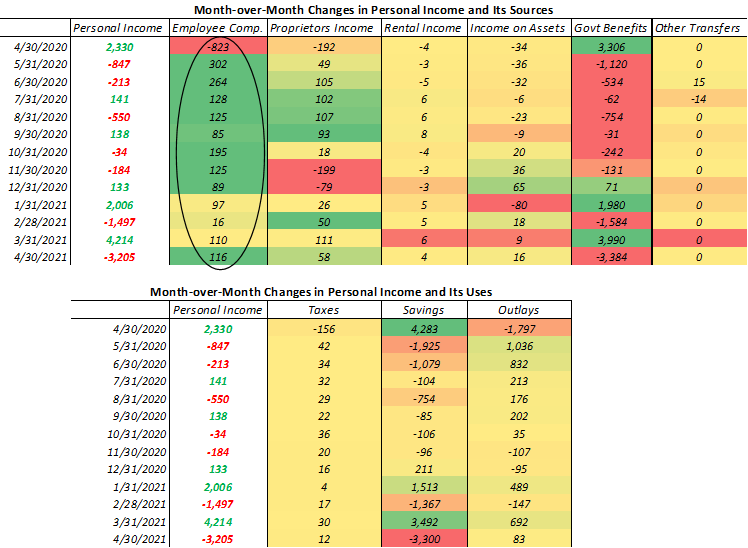
While direct fiscal transfers have now faded, we see that reopening has allowed employee compensation to continue to have positive momentum (circled above). We expect that this sustained momentum in employee compensation, along with accumulated savings during lockdowns, should continue to power spending in the immediate term. This is consistent with the systematic output from our Spending Index:
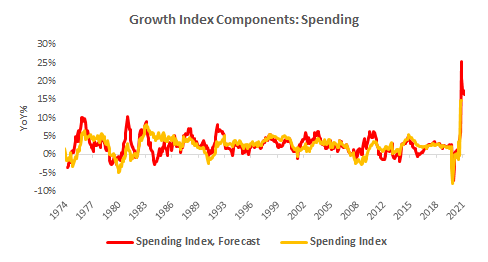
Our systematic forecast is 62% accurate in forecasting the direction of our Spending Index and consistent across all major spending and income items. Hence, we take the considerable signal from our near-cast.
Liquidity Growth Is Broad-Based
As part of our analytical framework, we assess the health of the countries’ income statement via growth and inflation and the health of its balance sheet via liquidity. Below, we show our Liquidity Monitor, where we show our measures of broad liquidity, along with a heatmap with its major constituents:
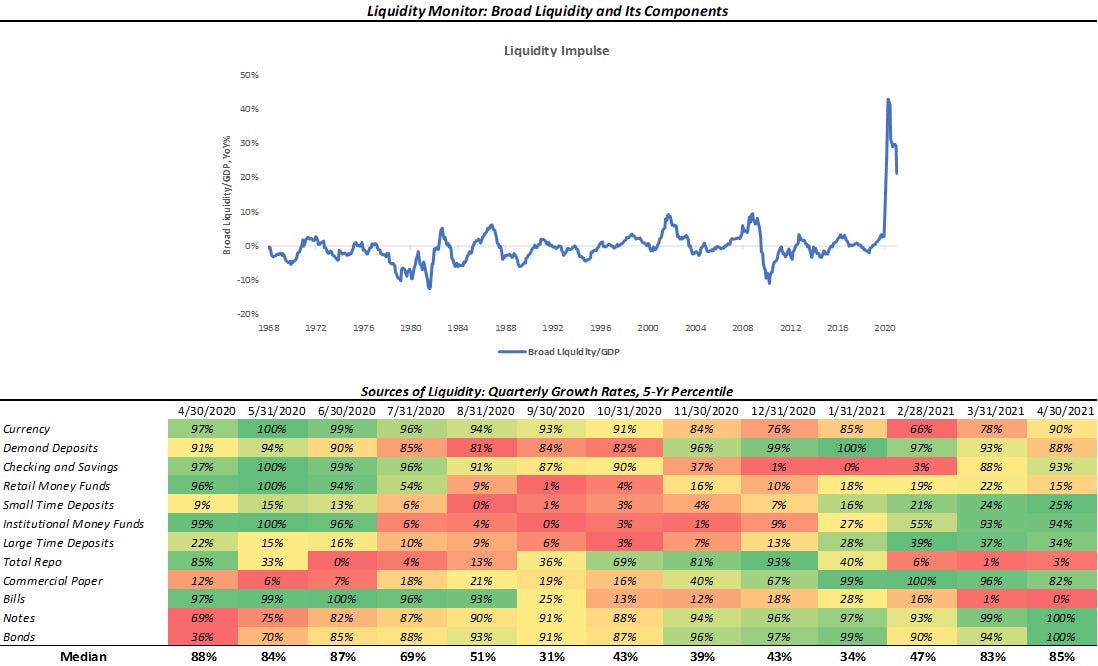
While this is indeed a beta version of our Liquidity Index (coming soon), we think it is important to bring you our insights in a timely fashion. Above, we can see that our measures of liquidity are indeed at record highs. While most of these gains came last year during the peak of the crisis, liquidity has continued to expand, as evidenced by the heatmap above. Particularly, we see the largest quarterly growth in Treasury assets, consistent with the aggressive fiscal stimulus the Biden administration is currently engaged in. In addition, the Fed’s current QE program is augmenting this stimulus. We expect both the continue over the next few months, i.e., liquidity is likely to remain abundant and continue to support real and financial investments.
Markets Are Increasingly Pricing (-) G (+) I
Using the performance of various asset classes, we can extract what markets are implying which particular economic regime we are in. Below, we show what markets are telling us about the current growth and inflation regime:
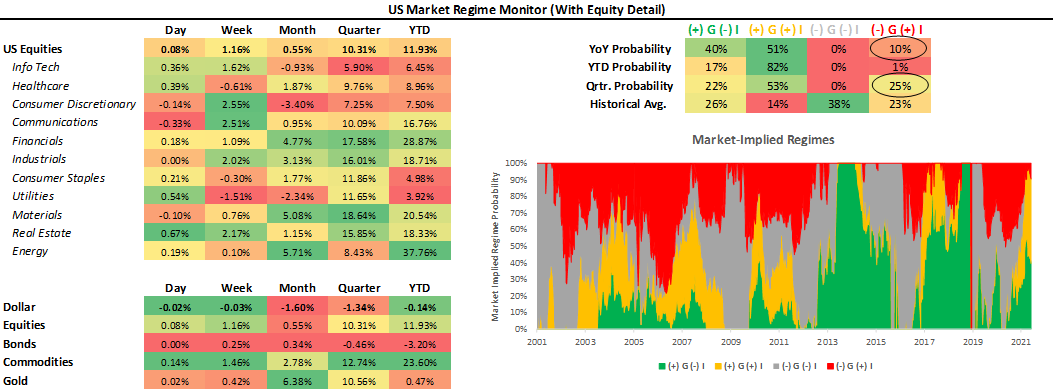
As we have mentioned before, we can be in one of four regimes:
(+) G (-) I: Rising Growth, Falling Inflation
(+) G (+) I: Rising Growth, Rising Inflation
(-) G (+) I: Falling Growth, Rising Inflation
(-) G (-) I: Falling Growth, Falling Inflation
Using our understanding of asset markets, we can classify periods of time into one of the four regimes mentioned above. Since our last note, the market-implied odds of us being in falling growth, rising inflation environment has increased from 0% to 25%, when looking at the quarterly changes in asset prices. These moves are consistent with our expectations, driven by our systematic growth and inflation forecasts. We take a strong signal from these moves and think it is time to gradually adjust our portfolio exposures to reflect the slowing growth environment we are headed towards.
Economic Growth Is Likely Peaking: Allocate Accordingly
Our systems point to economic growth peaking in the current period. There are two things to keep in mind with this forecast. The first is that our systems are dynamic and get more accurate as we get closer to the forecast period. The second is that while they point to slower growth and inflation, they are still pointing to elevated levels of both. Hence, we think that risk could likely remain well supported but could just as likely see a redistribution of sector leadership in equity markets:
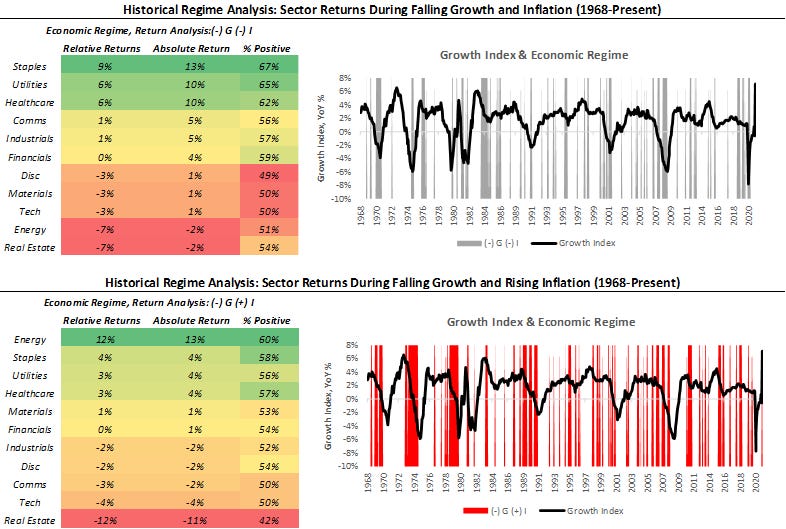
As we can see above, history has typically favored a different equity allocation mix during falling growth periods than is currently favored. Hence, as growth and inflation begin to stabilize at higher levels, we could see a significant catch-up in lagging sectors. This means that sectors currently out of favor, i.e., staples, healthcare, and utilities, could catch up to the reflation trades, i.e., financials, energy, real estate, industrials, and materials. On the asset class front, gold, TIPS, and nominal bonds would start to look more attractive relative to stocks, credit, and commodities. Of course, timing regime shifts is not a precise art, but we think incrementally adjusting portfolio exposure consistent with the lessons of history would be wise.
Conclusions
To reiterate our findings:
Current economic data continues to point to robust GDP Nowcast.
Liquidity growth remains strong and broad-based, albeit not at the pace we saw last year.
Markets are increasingly beginning to price a slowing growth, rising inflation environment.
Our systematic forecasts are pointing to peaking economic growth rates this month.
Therefore, growth and inflation are peaking, and liquidity growth remains elevated. While growth and inflation are likely to remain elevated, it is improbable they will continue their torrid ascent. On the other hand, liquidity will probably continue to grow steadily on the back of joint monetary-fiscal policy, which will continue to support both asset prices and the real economy. Overall, we think the set-up is for markets to remain supported, but there is significant room for redistribution of relative returns between assets.