

Economic & Market Views
Economic & Market Views
Is growth trending lower?

Today, we offer updates on our economic and financial near-casts, along with our market regime views. As always, we focus on what the economic data tell us about the economy’s current state, what markets tell us about expectations, and our systematic near-casting framework telling us about the near-term. Additionally, we show our Market Regime Portfolio, which applies our understanding of market-implied regimes and portfolio construction to give us a sense of the best exposures in the immediate term. Our observations are as follows:
Growth rates are starting to normalize. Our systematic tracking and forecasting of economic growth shows economic growth rates now beginning to resemble historical norms, however, growth is still elevated, hovering at the 85th percentile of historical distribution.
Inflation rates continue to remain elevated. Unlike economic growth rates, inflation rates have proven resilient in their levels. Our systematic inflation tracking shows broad-based inflationary pressures at higher levels than we have witnessed in the last decade.
Liquidity conditions moderated their descent this month, remaining roughly unchanged. From a private sector perspective, liquidity conditions look set to tighten over the next few months, on the back of reduced QE and increased Treasury issuance (debt ceiling resolution).
Markets continue to price (+) G, i.e., rising growth. Markets continue to debate the nature of today’s expansion, going back and forth between pricing rising and falling inflation as a dominant regime but remain consistent in pricing rising growth.
The future is dynamic, and our systems adjust as new information is available. Our bias is to allocate for the existing regime while trying to peek around the corner to what the future may hold. Our Market Regime Portfolio aims to capture the current macroeconomic trend, and our systematic forecasts serve as our way of estimating what the next trend is likely to be. After losses elicited by the short-term risk-off regime in September, our Market Regime Portfolio finished the month up 6%, taking cumulative performance up to 24.7% for 2021. Our Market Regime signal continues to switch back-and-forth between (+) G (+) I and (+) G (-) I, as we talked about in our last publication, where we said:
“We designed our system to be aggressive, wholly allocating to the current Market Regime, and a more balanced approach would likely spread bets a little wider. From a discretionary perspective- given the nearly tied odds between (+) G (+) I and (+) G (-) I, we think it is worth considering a bias towards rising growth assets but to remain less aggressive on inflation tilts.”
We continue to believe that this logic applies and that (+) G exposures are likely to be rewarded in 2021. As we have reiterated here several times, our 2022 outlook is not as conducive to risk. We discuss this in the pages that follow.
Economic Growth: Normalizing, But Not Yet Normal
Our Growth Index is our high-frequency measure of the growth impulse to GDP from a wide range of comprehensive economic data. The Growth Index has four subcomponents: risk premia, spending, production, and labor markets. The index measures economic activity at a higher frequency (monthly) and lower latency than quarterly GDP. Current economic data, which feeds the Growth Index, is currently pointing to 3.4% real GDP growth:
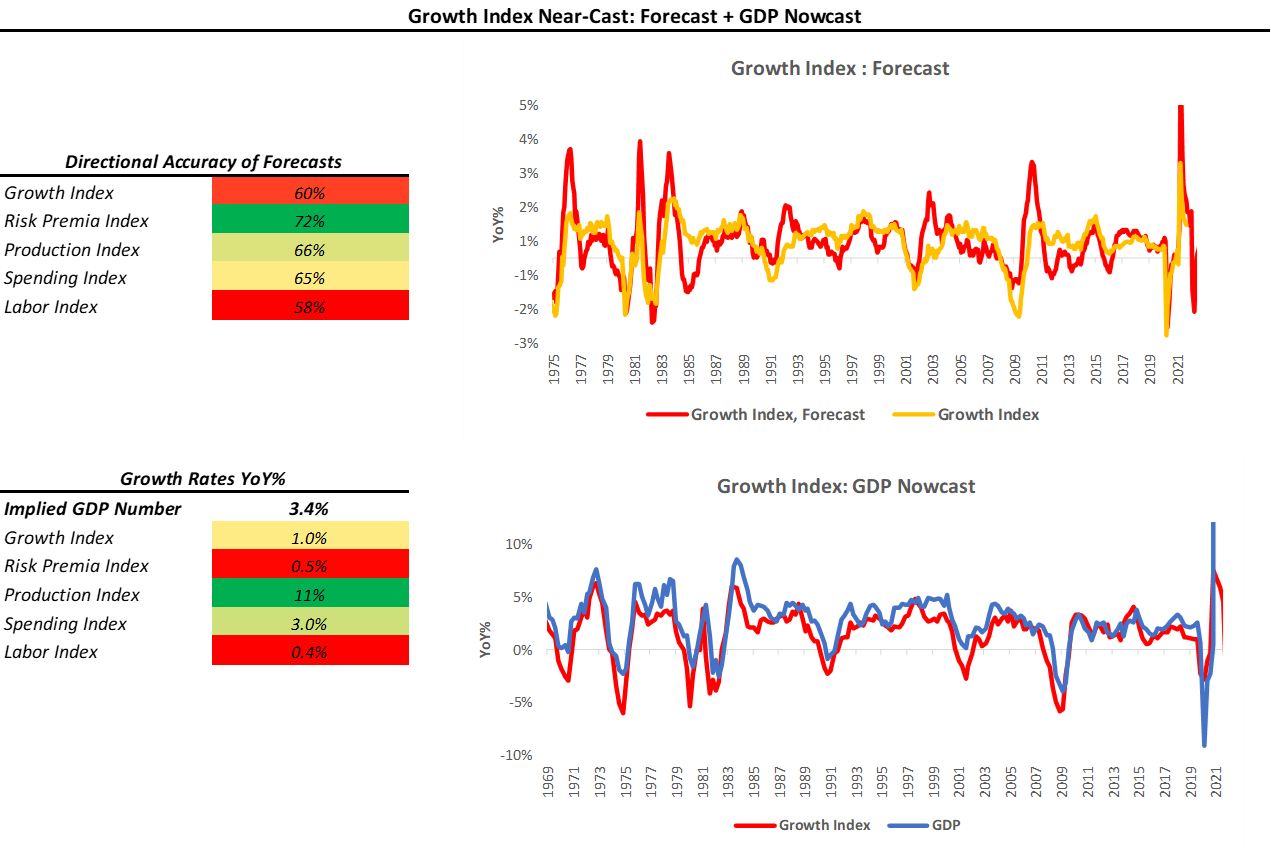
As we can see above, the Growth Index estimates real GDP growth in real-time. The Growth Index has a directional accuracy of 88% in nowcasting real GDP growth. More importantly, unlike many regression-fitted estimates, our Growth Index has greater accuracy in nowcasting GDP downturns- our downside directional accuracy is 95%. When we think about our Growth Index, we prefer to focus not on the estimated magnitude of the nowcast but rather the acceleration or deceleration of the nowcast. As we can see above, our Growth Index implies GDP growth of 3.4% on a year-over-year basis, a decrease increase since our last publication, where it was at 3.9%. Additionally, we can break parts of the Growth Index into Sub-Indexes to show the distribution of economic forces:
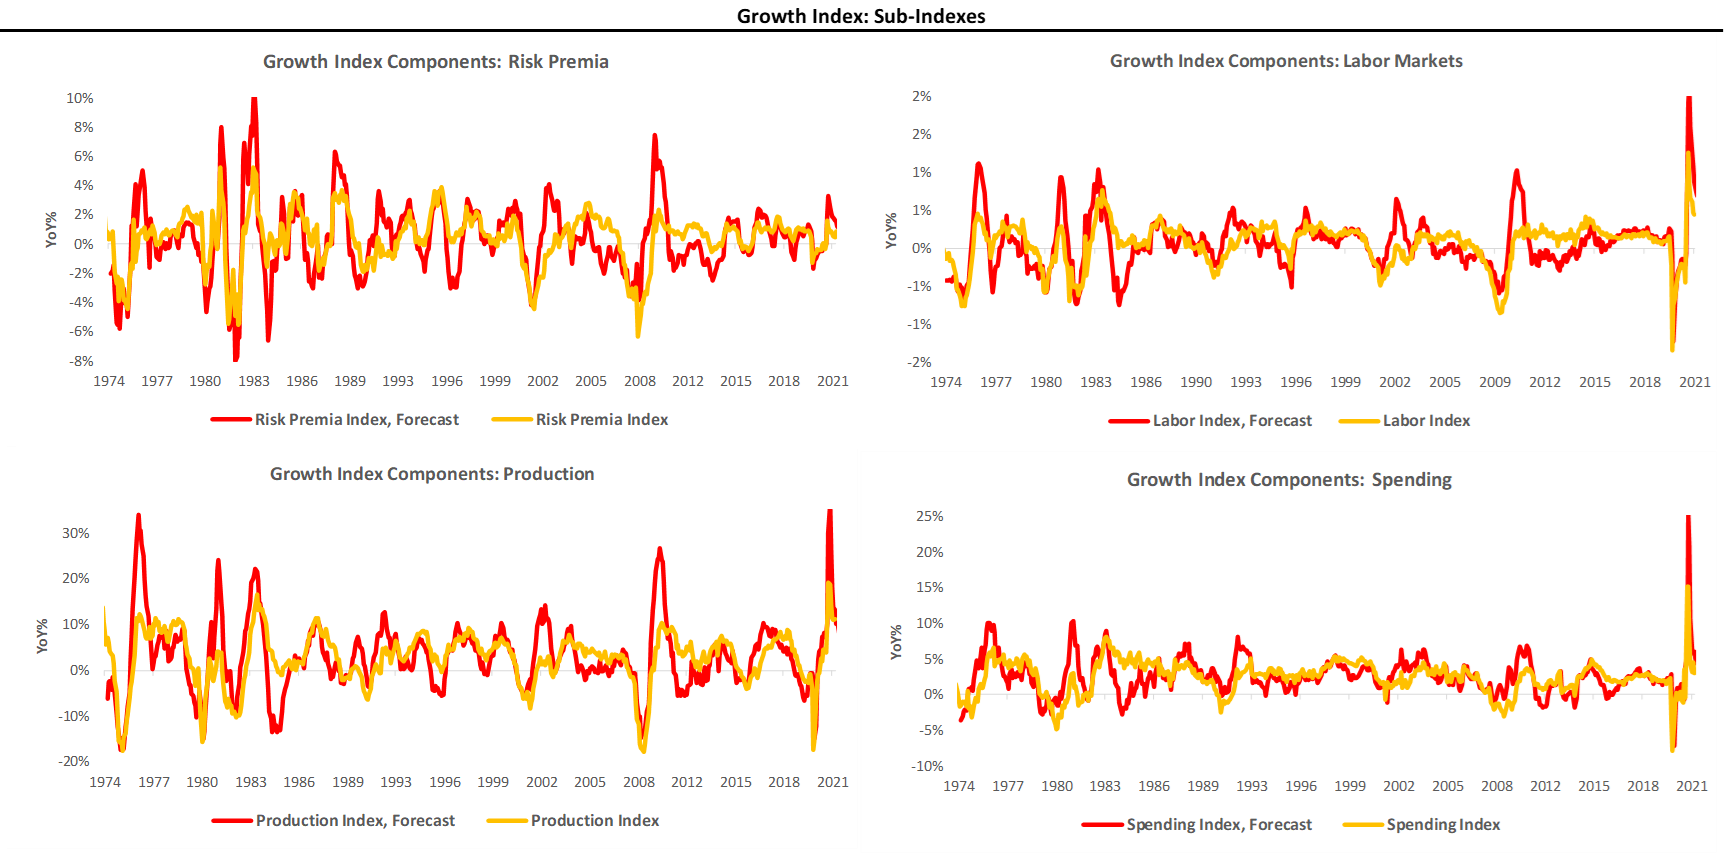
As we can see above, growth remains broad-based and elevated but continues to trend lower as our systems expected. Additionally, we offer some further detail on incomes and spending:
As we can see above, the incomes continued to increase on the consistent growth in employee compensation, along with sporadic (but large) injections from government benefits. As these government benefits fade, there is a proportional decline in savings rates, i.e., as government benefits recede, so do incremental additions to household cash balances. With a more significant portion of income now finding its way into spending, we show how it is being spent:
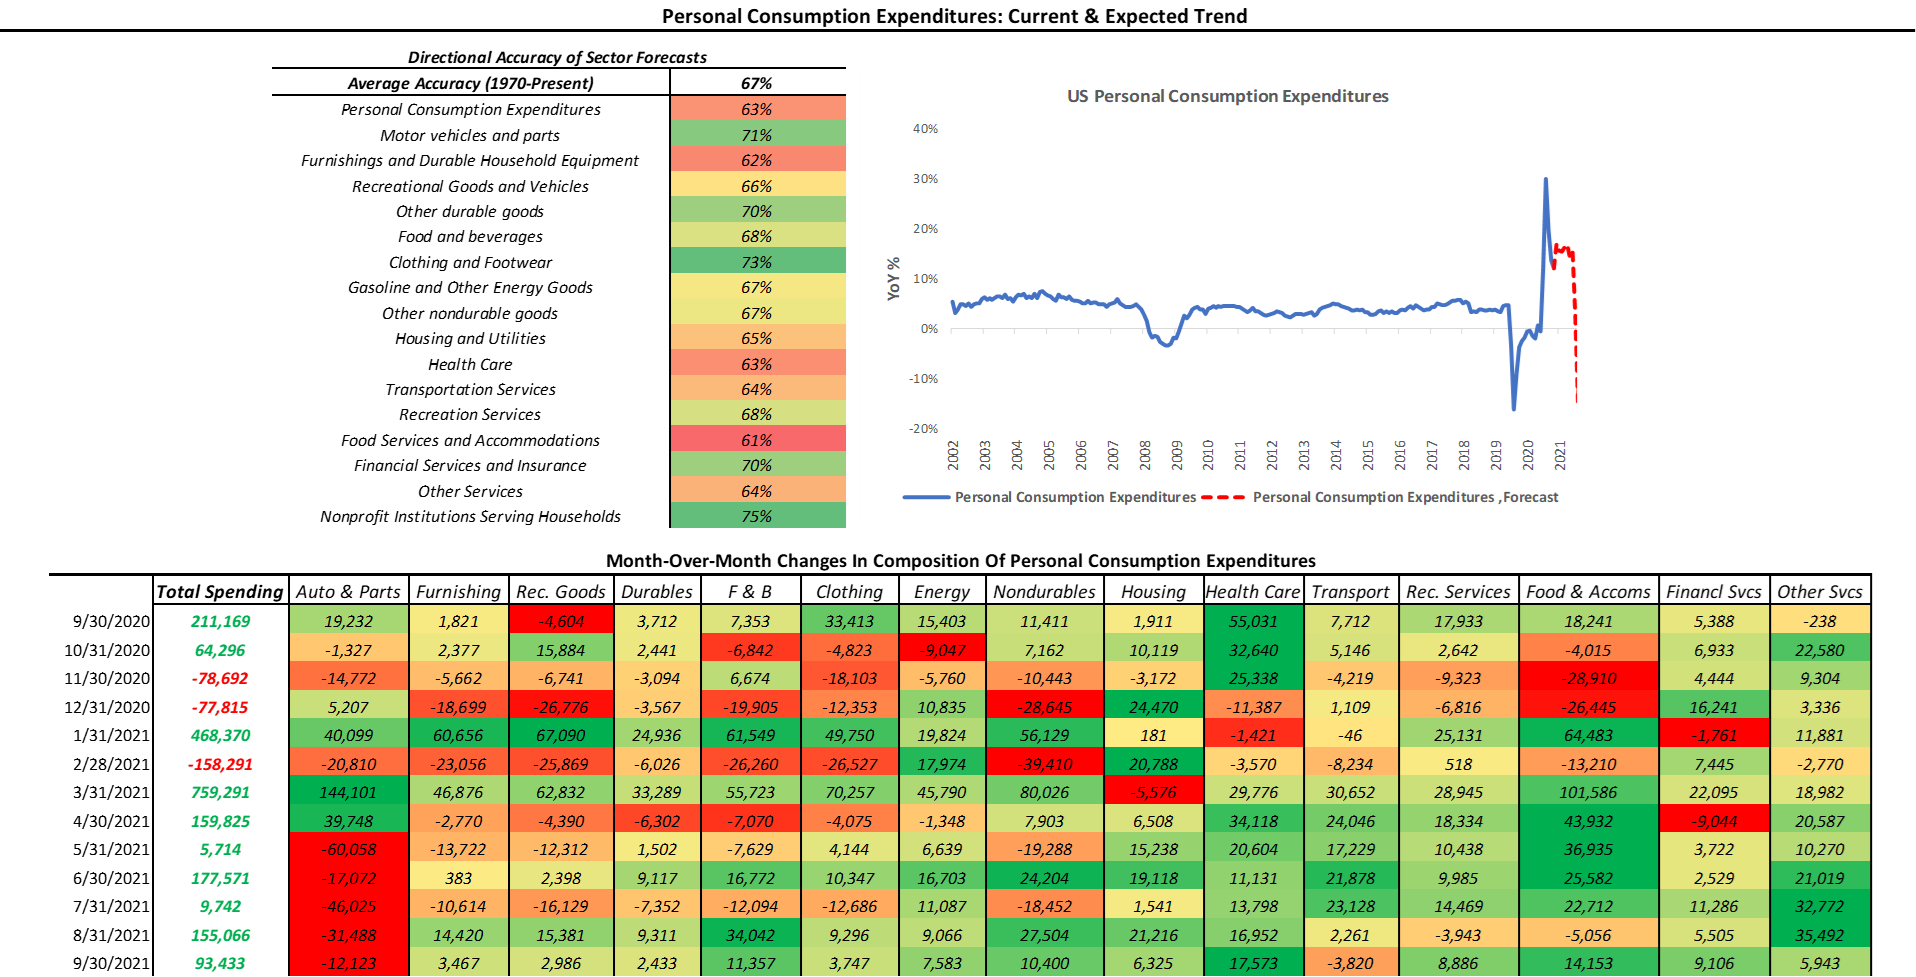
Food & accommodation, food away from home, and healthcare continue to be items that attract a large share of spending. Furthermore, after rampant demand earlier this year, automobile spending has moderated significantly in the last few months. From a discretionary perspective, spending data seems to have compensated for imbalances created during the heights of the pandemic, i.e., the theme of spending rotation may be retired soon. The combination of all this data has led to an environment where economic surprises are roughly around their historical mean:
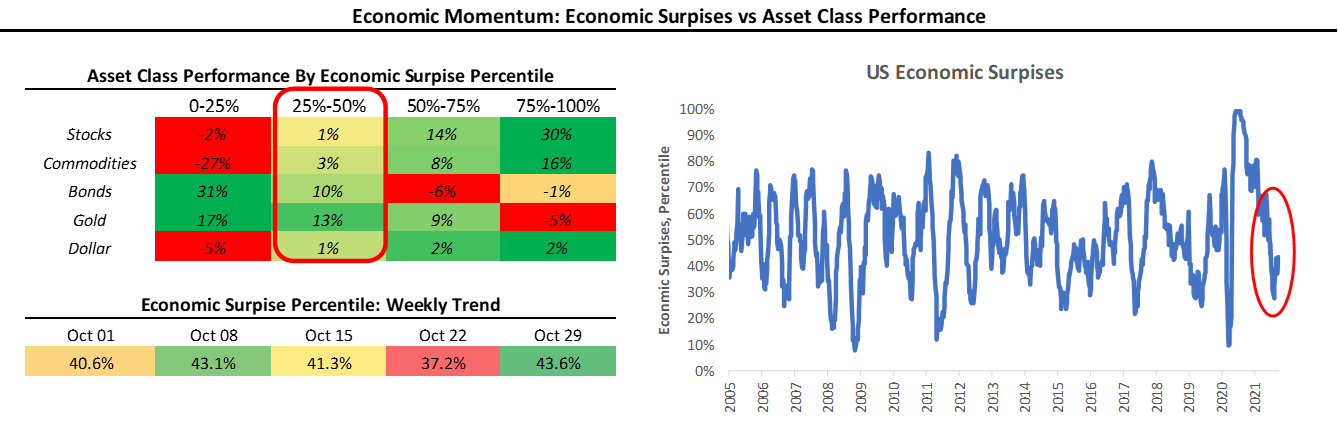
With the latest reading at 43.6%, realized economic data relative to expectations are sufficiently far from the lowest quartile of economic surprises, where the distribution of returns for risky assets becomes more negative. However, as we have mentioned previously, we are increasingly likely to end up there in Q1-Q2 2022. This move, if realized, will likely be driven by declining liquidity. The liquidity transmission mechanism takes several months to a year to find its way into real economic data. Therefore, we expect the deteriorating liquidity impulse (which we have documented here consistently) to find its way into deteriorating economic conditions in 2022. We show how this has borne out over past cycles below:
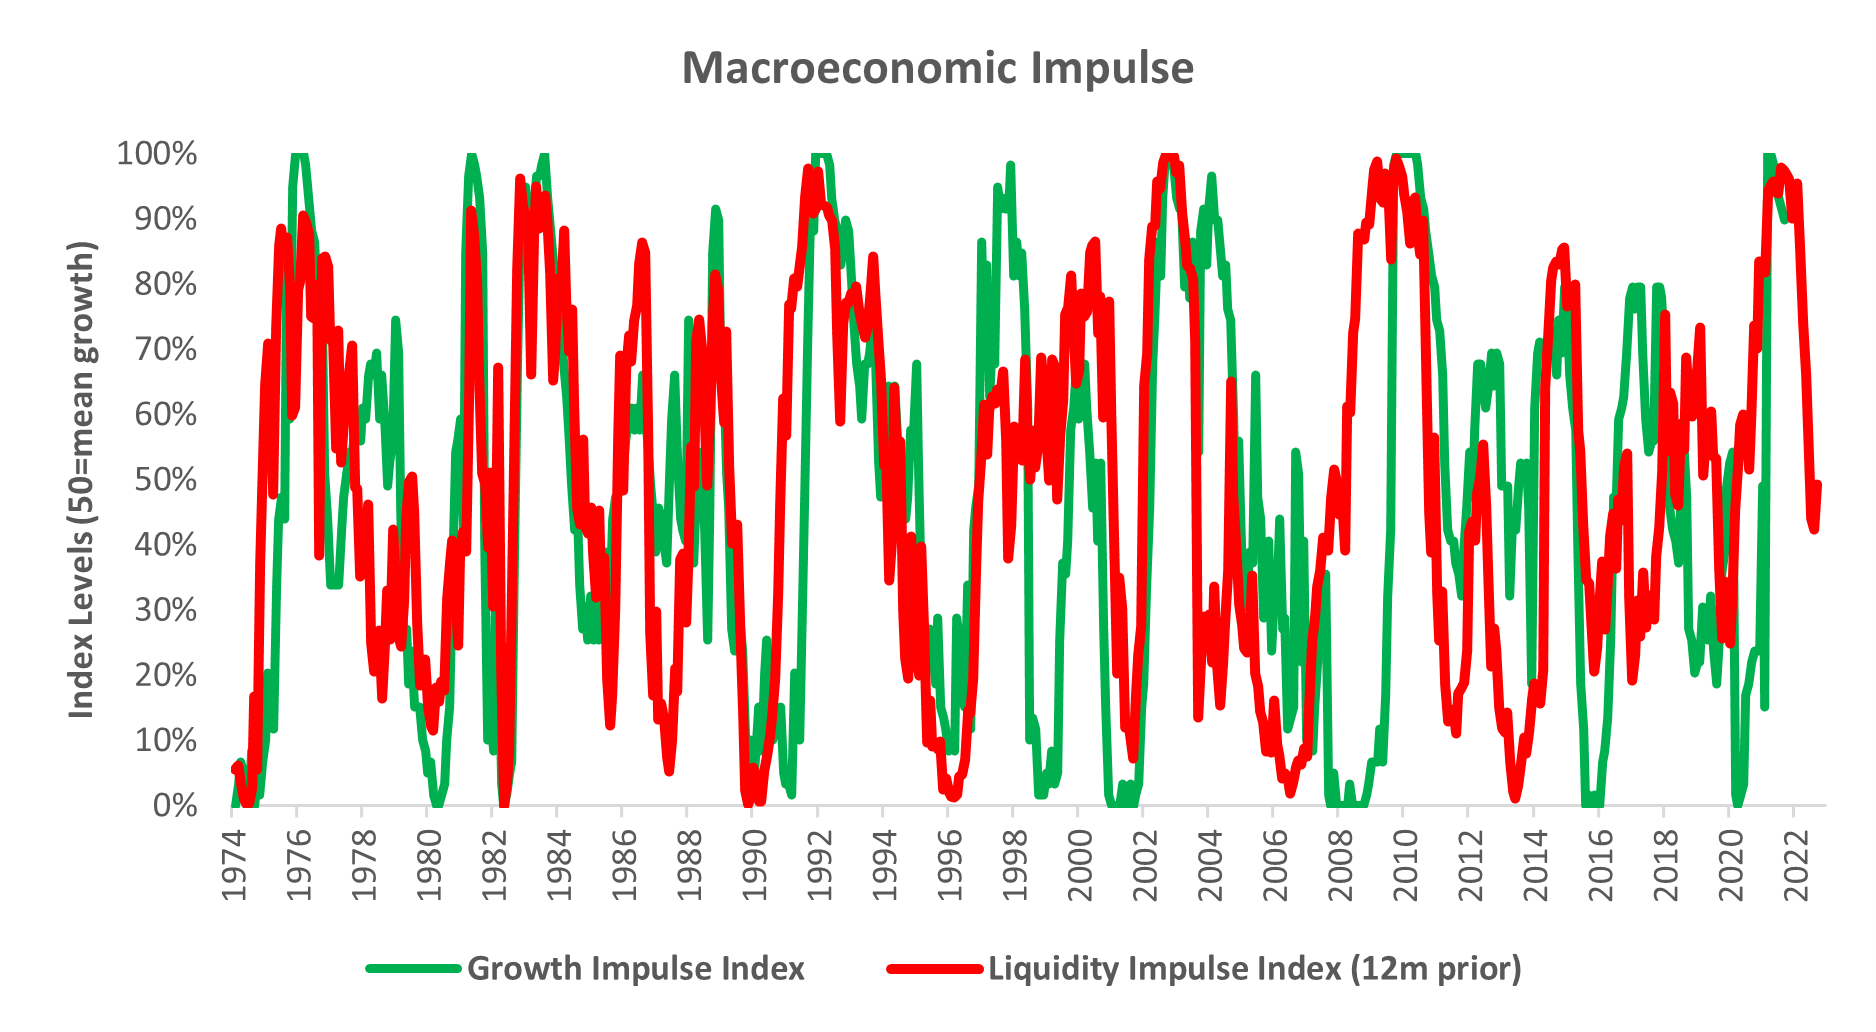
Above, we show our Policy Liquidity Impulse Index 12 months ago versus our Growth Impulse Index. As we can see, while there have been variations in cycle-time, moves in significant changes in liquidity typically tend to result in changes in subsequent economic activity. Therefore while growth rates remain elevated, at approximately their 85th percentile of the last 50 years, our systems expect growth rates to continue on their downtrend.
Inflation: High And Stable
Our Inflation Index is our high-frequency measure of the impulse to inflation from a wide range of comprehensive inflation data. Our Index Index aggregates data across measures of Spending, Expectations, and Commodities to give us an understanding of the degree and pervasiveness of inflation. Further, our Inflation Index allows us to nowcast inflation on an ongoing basis, giving us some insight into upcoming CPI prints:
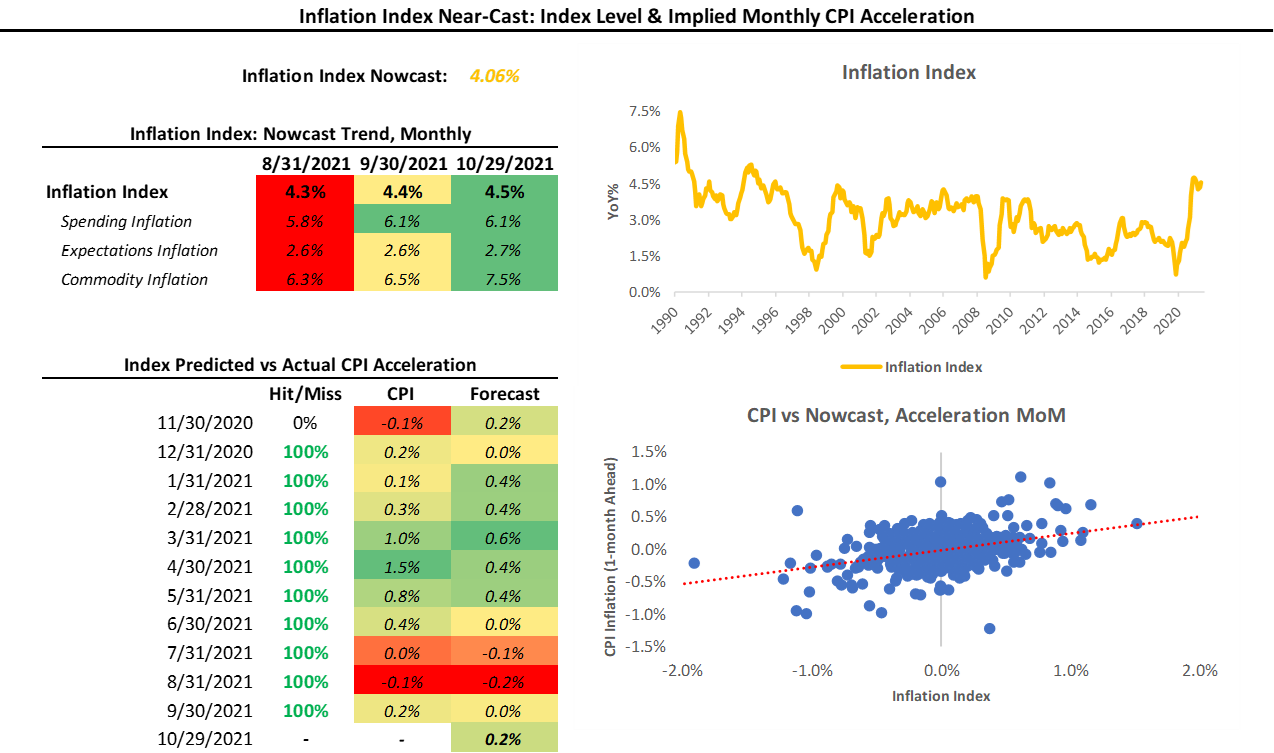
Our Inflation Index currently sits at 4.06%, essentially unchanged from our last publication. We expect that this elevated level will reflect itself in still high CPI prints. Our Inflation Index has been 58% accurate in determining the acceleration or deceleration of the following print in CPI since 1980. Over the last 12 months, the Inflation Index has had a 92% accuracy in estimating the monthly acceleration in CPI. Given the recent accuracy of the Inflation Index, we take a considerable signal from its further strengthening since our last publication. To complement the immediate-term view provided by the Inflation Index, we also offer our systematic CPI forecast to estimate the future cyclical trend in inflation:
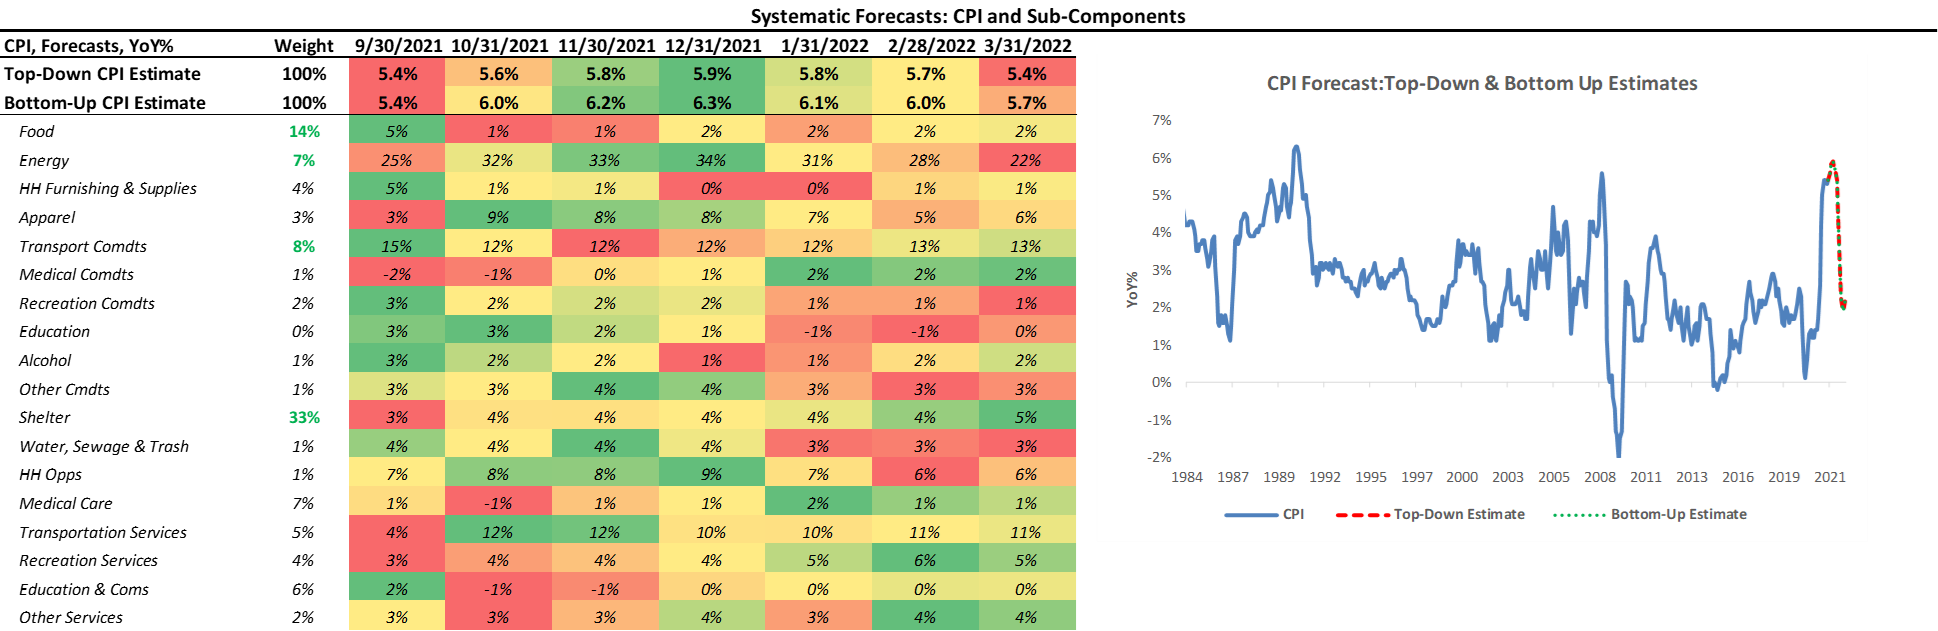
Above, we show our systematic forecasts of CPI and its subcomponents. We include both a top-down estimate and a bottom-up estimate- obtained via forecasting each subcomponent. As we said in our last publication:
“There has been (and continues to be) a debate on the underlying nature of inflation- i.e., whether the current strength in inflation is transitory. A significant component of this debate is the underlying secular dynamics that modulate inflationary pressures and underly cyclical moves in inflation. The question before us today is whether these secular dynamics have been altered in a way that changes the underlying inflationary trend to one that is higher than the pre-pandemic trend. We are still building the machinery to evaluate these underlying trends quantitatively; therefore, we remain hesitant to express views on the subject. However, from an empirical perspective, it is clear that the underlying trend has shifted higher. Therefore, we think it prudent to assess and evaluate inflation on a print-by-print cyclical basis.”
Our view remains that this is the optimal approach during an environment with a highly uncertain inflation outlook. Therefore, we will continue to closely monitor changes in our Inflation Index to assess inflation dynamics.
Liquidity: Declines Imminent
As part of our analytical framework, we assess the health of the countries’ income statement via growth and inflation and the health of its balance sheet via liquidity. Below, we show our Liquidity Monitor, where we offer our measures of the Liquidity Impulse coming from policy & the Private sector. Additionally, we provide the normalized growth of some of the major subcomponents in the heatmap: (please note our Private Impulse is a beta version)
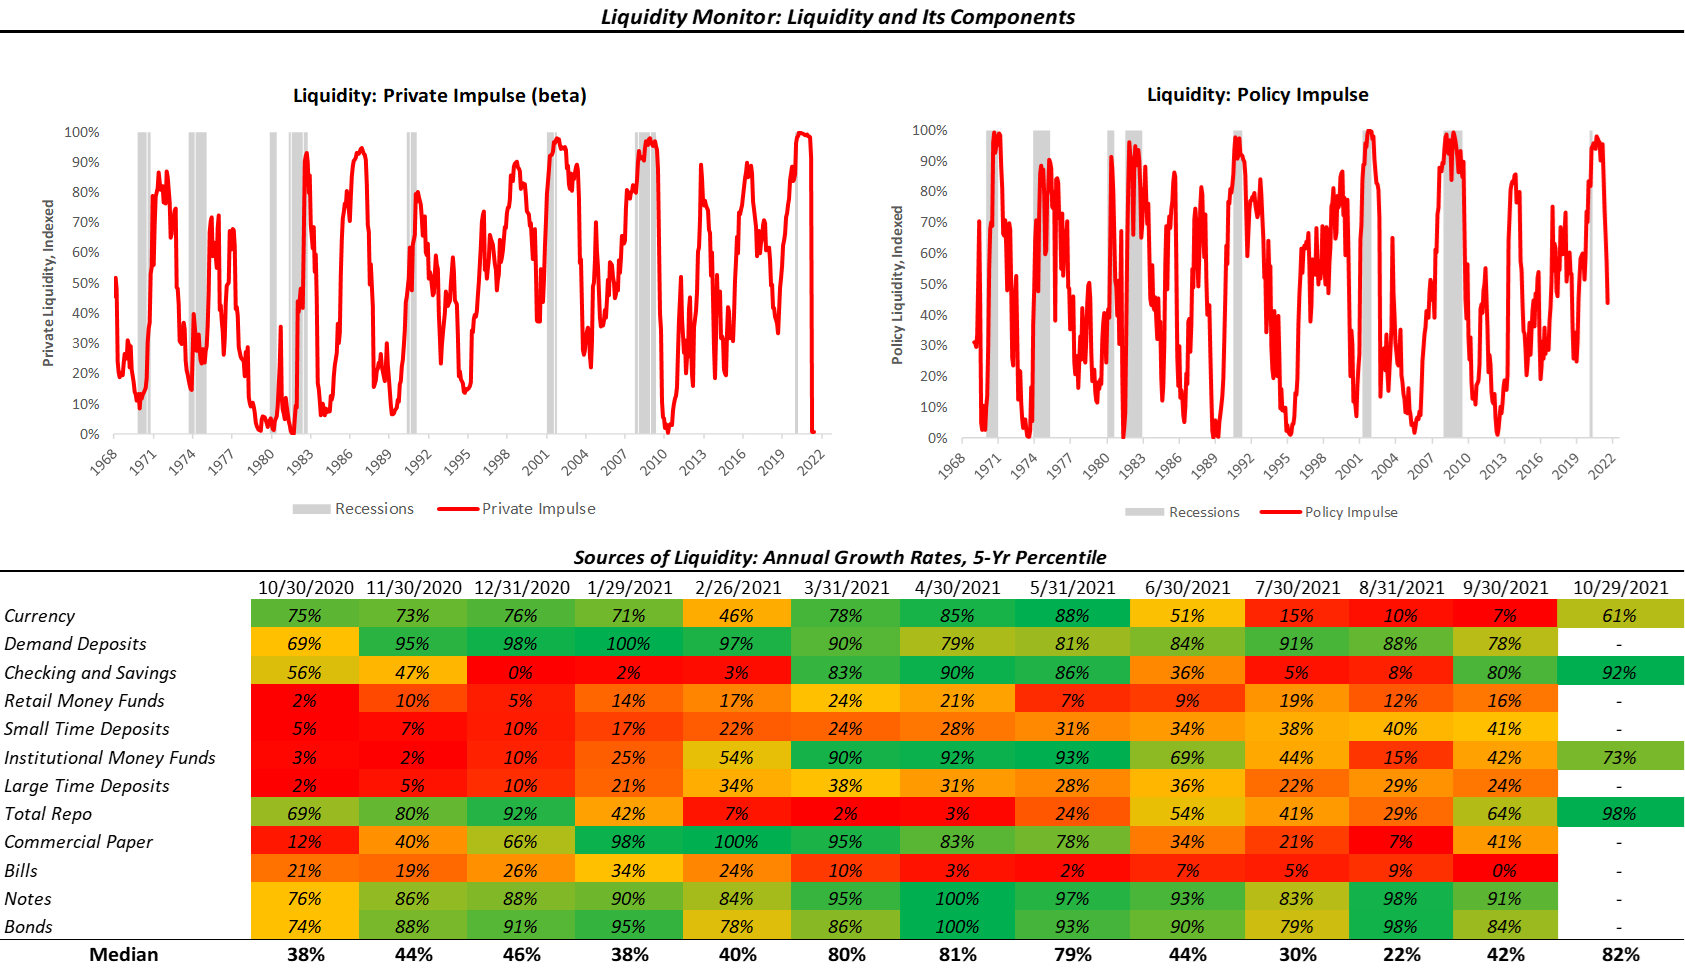
To offer further insight into the liquidity environment, we show some simply-sum measures of the aggregates above. For ease of reading, we show some of the simple-sum components of liquidity, grouped into Real Economy, Market Finance, and Government Finance:
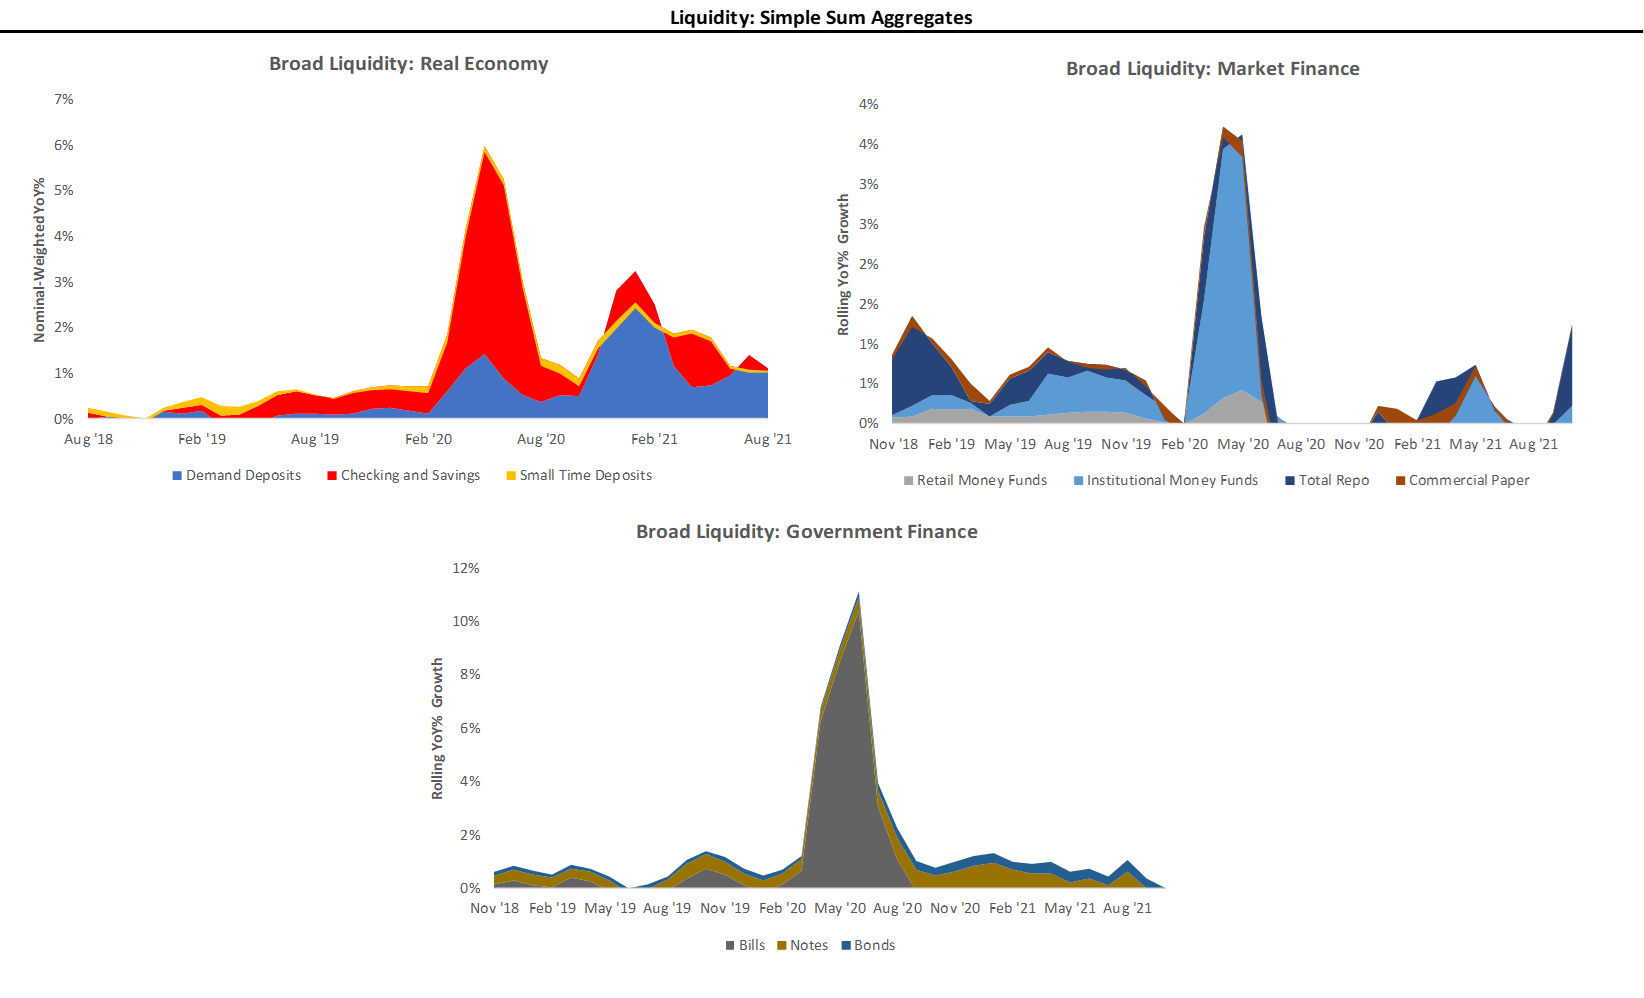
As we can see above, cash balances in the economy continue to grow at a robust pace relative to history. At the same time, government financing has dwindled due to the debt ceiling debacle. Finally, when we look at measures of market finance, we see that repo activity has accelerated significantly. We interpret the increases in the reverse repo and repo activity as reflective of the shortages of pristine collateral (Treasuries) for cash managers to invest funds, leading to a rapid rise in these alternative liquid assets.
Looking ahead, we expect the Federal Reserve to reduce the rate of reserve creation, which will decrease liquidity creation. Furthermore, the US Treasury is likely to increase debt issuance as its cash balances run low. The combination of these two factors will drain liquidity from the financial system over the next few months. However, we must recall that Treasuries in themselves are a source of liquidity, as the Treasury essentially repurposes private sector funds, i.e., it drains liquidity by raising debt, only to reinject it by spending it. Nonetheless, we don’t expect fiscal policy injections to rival those we have seen during the peak of COVID-19. Therefore we are uncertain that they will fill the void created by the withdrawal of monetary policy support. From a systematic perspective, our Policy Impulse Index is already flagging the decline in policy liquidity:
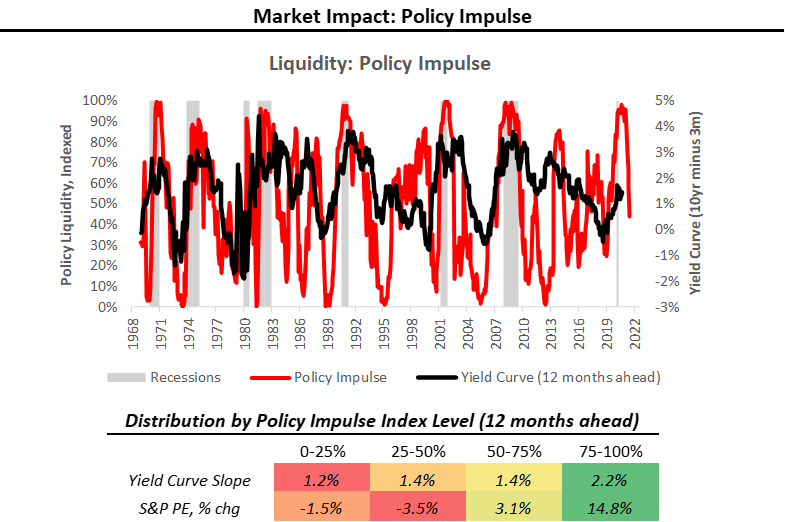
The Policy Impulse Index typically rises to precede steepening yield curves and richening valuations. This relationship is because the Policy Impulse Index measures pristine liquidity coming from monetary and fiscal authorities, which form the capital base that can migrate to risk-taking and economic growth. Today, the slowdown in liquidity growth essentially reduces the “dry powder” available for the same process in the future. Therefore, the reduction in liquidity will eventually find its way into the financial assets and the economy, but likely with a lag. We think it is worth noting that our systems imply worsening declines in policy liquidity are likely to be coincident with slowdowns in real growth, making the situation all the more precarious for risk assets. We continue to monitor this closely.
Market-Implied Regime: (+) G
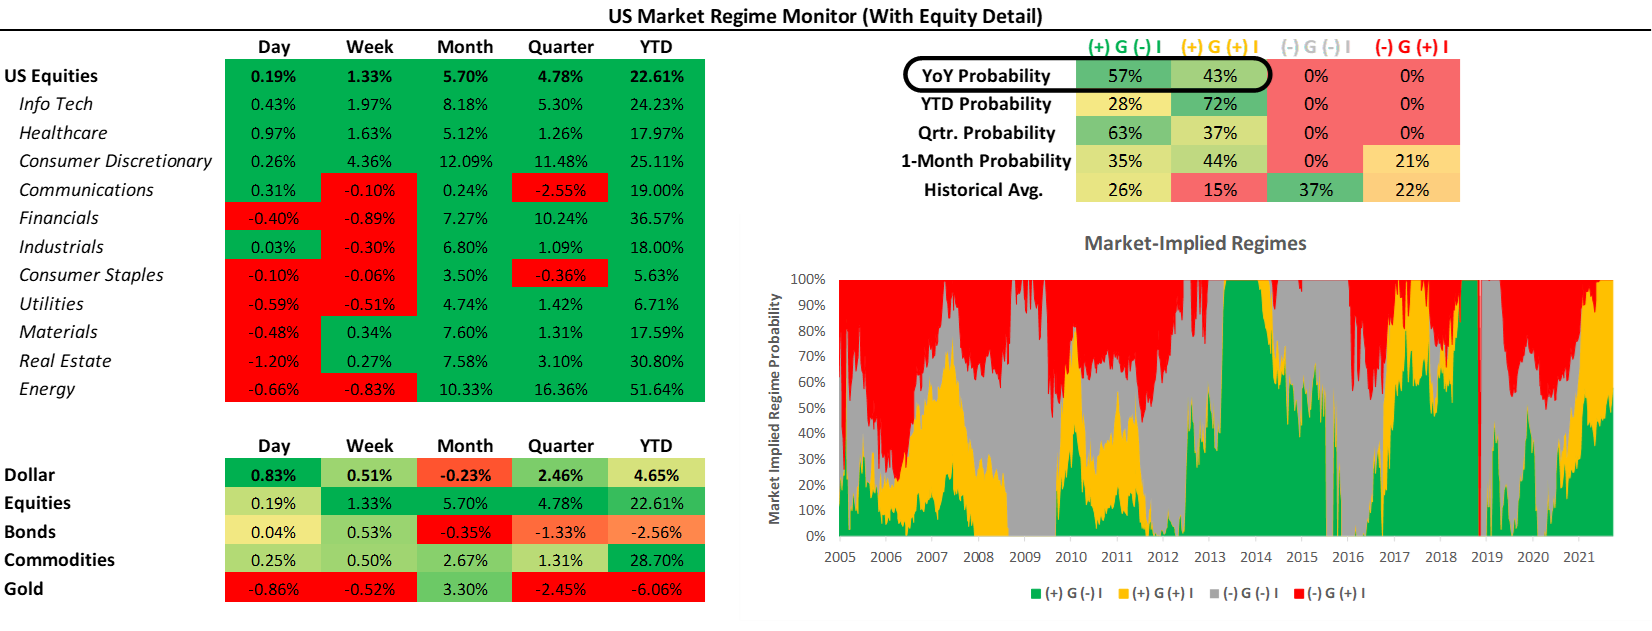
Using the performance of various asset classes, we can extract what markets are implying which particular economic regime we are experiencing. Below, we show what markets are telling us about the current growth and inflation regime:
As we have mentioned before, we can be in one of four regimes:
(+) G (-) I: Rising Growth, Falling Inflation
(+) G (+) I: Rising Growth, Rising Inflation
(-) G (+) I: Falling Growth, Rising Inflation
(-) G (-) I: Falling Growth, Falling Inflation
Using our understanding of asset markets, we can classify periods into one of the four regimes mentioned above. Further, we can use the regime obtained from our market-implied odds with trend-following and cross-sectional momentum measures to create portfolio signals. To provide maximum accessibility, we truncate the portfolio construction into three stages:
Asset Class Selection: We create a portfolio that selects asset class exposure based on the current market-implied regime.
Sector Rotation: We create an equity rotation portfolio that chooses sectors based on their market-regime preference- to avoid overfitting, we choose these logically rather than based on our historical regime performance.
Unlevered Portfolio: We combine Asset Class Selection and Sector Rotation.
Market Regime Portfolio: Finally, we create our Market Regime Portfolio by ex-ante targeting equity volatility, i.e., we use leverage to match equity volatility.
Below, we show the results of this process versus major asset classes. Additionally, we offer the performance characteristics over the decades since the 1970s:
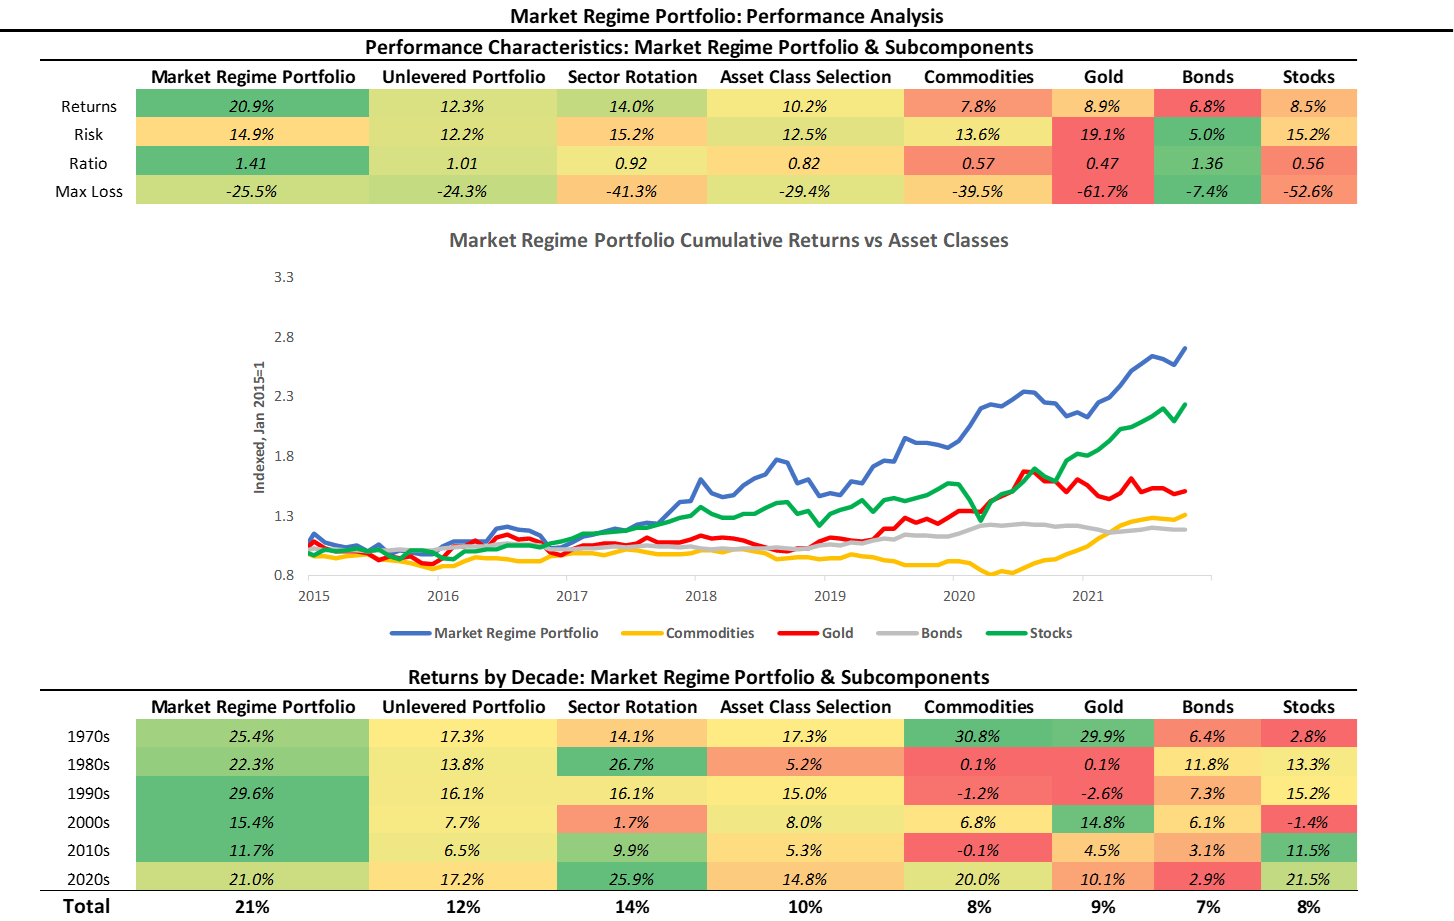
As we can see above, our systematic Market Regime Portfolio has a strong performance across measures and is consistent over time. The portfolio is designed to be decisive and aggressive, wholly allocating to assets that prefer the current regime, with no diversifying exposures. Currently, markets have been dominantly pricing (+) G (-) I, i.e., rising growth and inflation. However, markets have been moving back-and-forth between (+) G (-) I and (+) G (+) I, leaving uncertainty about the inflation regime. Therefore, as we said in our last publication:
“Given the closely contested battle between (+) G (+) I and (+) G (-) I, the signal has switched back-and-forth over the last few weeks. From a discretionary perspective, we think it is prudent for those using our signals to consider spreading their bets when it comes to the inflation bias of their trades but remain strongly tilted towards a growth bias.”
Our Market Regime Signal helps us understand the current market trend, and our systematic forecasts attempt to peer around the corner into the next regime. Currently, our systems expect the back-and-forth between rising and falling inflation to continue. However, the next major change to risk-manage will be the prospective transition to (-) G (-) I, which is currently being telegraphed by our systematic forecasts:
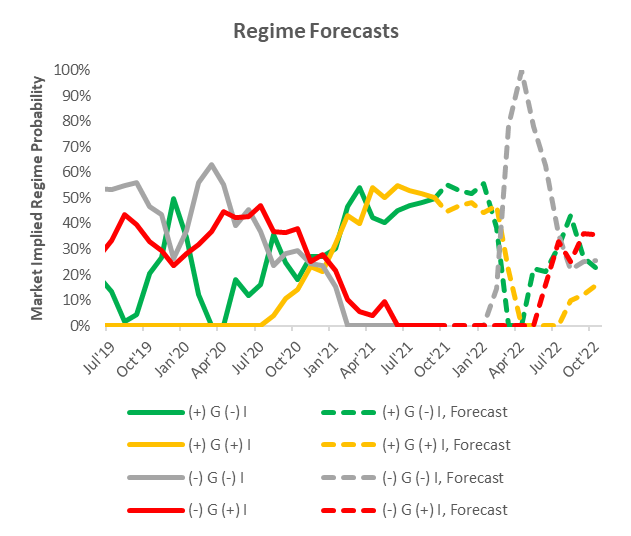
Our systems expected a regime change to occur approximately around March 2022. We will keep you abreast of changes to our systematic outlook. To help us deal with the risks of this possible change, we will be launching several trend monitors, which we are excited to share with you soon.
Conclusions:
To reiterate the signals coming from our systems:
Growth continues on its downtrend. Our systems expect this to continue until growth rates begin to decelerate meaningfully in 2022.
Inflationary pressures remain stable at high levels. The empirical trend in inflation has moved upwards, and only time will tell if this trend just outsized cyclicality. We think managing inflation risk on a print-by-print basis is optimal.
Liquidity drain is imminent. Tightening monetary accommodation, alongside drying fiscal cash balances, will facilitate lower liquidity support over the next few months.
Markets continue to price (+) G, rising growth. While there may be some back and forth about the inflationary nature of this rising growth environment, we remain in an environment that favors risk.
Overall, the environment still looks positive for risk and (+) G exposures. However, declining liquidity reduces the future potential for both market moves and economic expansion. Currently, our systems continue to point to conditions that will be conducive to risk. However, as the liquidity impulse (both monetary and fiscal) continues to decline, we expect the environment to become less conducive to (+) G exposures. We will keep you abreast of changes to our systematic outlook as they evolve. Until next time.
Thank you for your well written, well displayed and comprehensible report.
Great report! May I know what was in your portfolio that contributed to the 6% return, Good job there !