

Economic & Market Views

Today, we offer updates on our economic and financial near-casts, along with our market regime views. As always, we focus on what the economic data tell us about the economy's current state, what markets tell us about expectations, and our systematic near-casting framework telling us about the near-term. Additionally, we show our Market Regime Portfolio, which applies our understanding of market-implied regimes and portfolio construction to give us a sense of the best exposures in the immediate term. Our observations are as follows:
Economic growth continues to trend lower. The latest economic data has brought our GDP Nowcast sequentially lower, consistent with our systematic forecasts. The combination of elevated expectations and decelerating growth rates are our major concern for markets today.
Inflation remains elevated and stable. Our Inflation Index, which measures the broad impulse to inflation, shows continued stabilization. Our systematic near-casting process continues to imply a continuation of this trend.
Liquidity continues to dry up. Taking stock of the latest liquidity data, we continue to see a downward trajectory across the liquidity complex. Our Policy Impulse Index, which measures the liquidity impulse coming from monetary and fiscal policy, implies a flatter yield curve in 2022.
Markets are now pricing (+) G (-) I dominantly. After a few months of being signaled by our systematic forecasts, we have confirmation of a transition from (+) G (+) I to (+) G (-) I, implying a leadership hand-off from commodities to equities. Our Market Regime Portfolio will align with this transition.
The future is dynamic, and our systems adjust as new information is available. Our bias is to allocate for the existing regime while trying to peek around the corner as to what the future may hold. Our Market Regime Portfolio aims to capture the current macroeconomic trend, and our systematic forecasts serve as our way of estimating what the next trend is likely to be. As our systems have expected (and we flagged in previous notes), we have transitioned from a (+) G (+) I to a (+) G (-) I regime. This environment is likely to be sustainable in the intermediate term but limited by the slowdown in growth relative to expectations and the drying up of liquidity to fuel further compression in risk premia. Our systems point to a confluence of events that could make late-Q1 or early-Q2 a more difficult environment growth assets and potentially a (-) G (-) I regime.
We discuss all this in the pages that follow.
Economic Growth: Trending Lower
Our Growth Index is our high-frequency measure of the growth impulse to GDP from a wide range of comprehensive economic data. The Growth Index has four subcomponents: risk premia, spending, production, and labor markets. The index measures economic activity at a higher frequency (monthly) and lower latency than quarterly GDP. Current economic data, which feeds the Growth Index, is currently pointing to 3.8% real GDP growth:
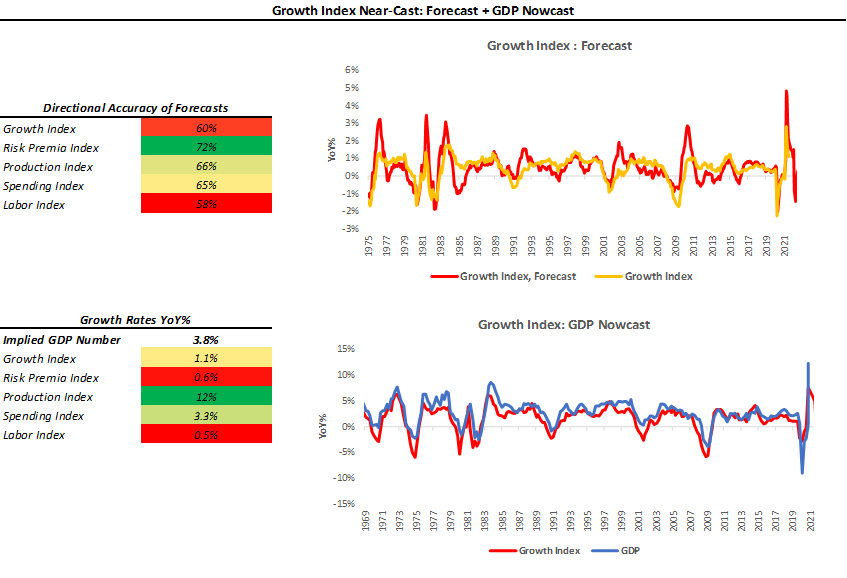
As we can see above, the Growth Index estimates real GDP growth in real-time. The Growth Index has a directional accuracy of 88% in nowcasting real GDP growth. More importantly, unlike many regression-fitted estimates, our Growth Index actually has greater accuracy in nowcasting GDP downturns- our downside directional accuracy is 95%. When we think about our Growth Index, we prefer to focus not on the estimated magnitude of the nowcast but rather the acceleration or deceleration of the nowcast. As we can see above, our Growth Index implies GDP growth of 3.8% on a year-over-year basis, a further slowdown since our last publication where it was at 4.0%. Interestingly, as growth rates have faded per our expectations, expectations for growth rates have grown elevated, especially heading into 2022. This dynamic has created an environment for consistent downside surprises in economic data, as we show below:
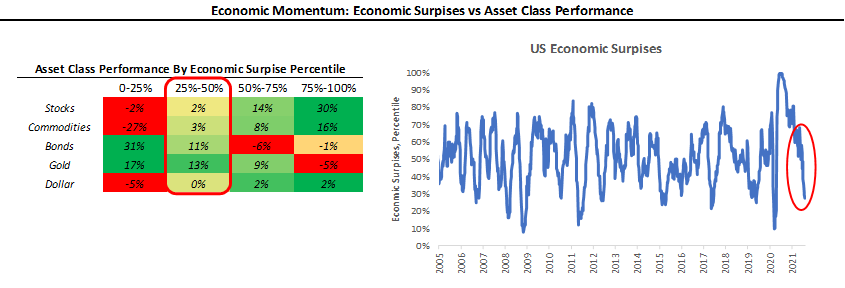
Indeed, we are heading into more difficult territory. Economic surprises are currently at 28%, down from 31% in our last publication, and getting closer to the lowest quartile of economic momentum, i.e., the 0-25% range- where equities have had a more negative distribution of returns. Based on our systematic outputs, we think there is a strong possibility of reaching this quartile in late Q1 or early Q2 of 2022. However, looking at the historical record, it is important to note that these periods are a rarity (7% of months since 2005) and short (lasting a maximum of 3 months, but never more than 1 month since 2011). Therefore, we are carefully watching the confluence of expectations and economic growth to understand the next moves for risk markets.
Inflation: Still Elevated
Our Inflation Index is our high-frequency measure of the impulse to inflation from a wide range of comprehensive inflation data. Our Index Index aggregates data across measures of Spending, Expectations, and Commodities to give us an understanding of the degree and pervasiveness of inflation. Further, our Inflation Index allows us to nowcast inflation on an ongoing basis, giving us some insight into upcoming CPI prints:
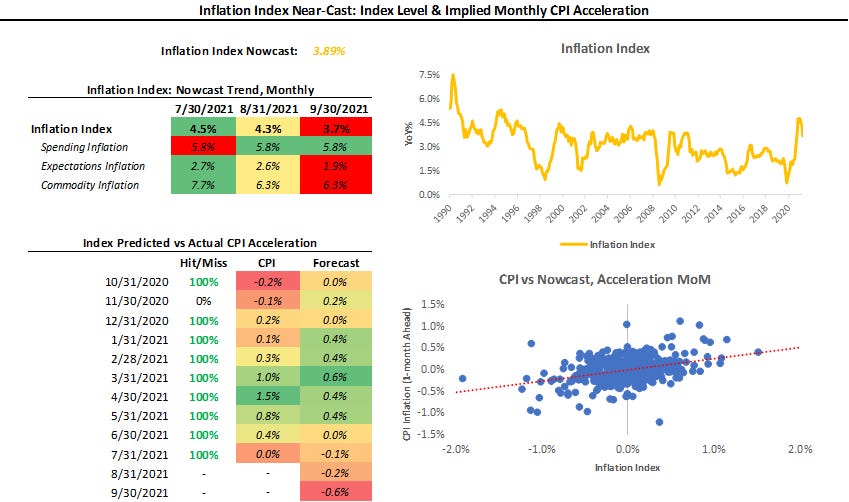
Our Inflation Index has been 58% accurate in determining the acceleration or deceleration of the next print in CPI since 1980. Over the last 12 months, the Inflation Index has had an 90% accuracy in estimating the monthly acceleration in CPI. Given the recent accuracy, we think it is important to note that the Inflation Index implies a moderating level of inflation in tomorrows CPI release. Consistent with our the impulse implied by our Inflation Index, our systematic CPI forecasts continue to tell us that inflation is likely to stable, but elevated for the rest of 2021, but then decelerates in 2022:
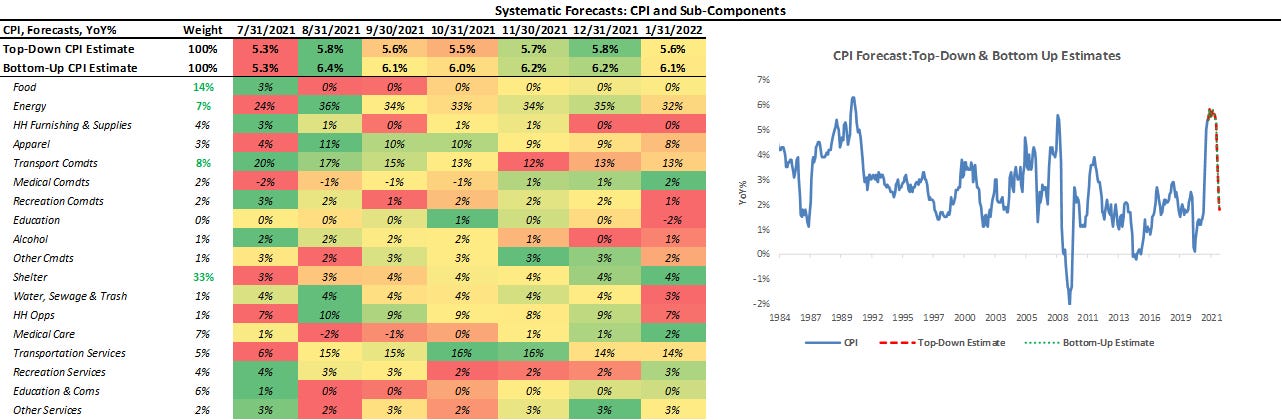
Above, we show our systematic forecasts of CPI and its subcomponents. We include both a top-down estimate and a bottom-up estimate- obtained via forecasting each subcomponent. As we can see above, our top-down and bottom-up estimates concur about the future inflation trend- i.e., that we are at peak inflation levels. Our systematic forecasts use measures of trend and measures of cyclicality to estimate the future trend in inflation. The inflation trend has been strong recently, leading to an elevated forecast level, which we expect to subside, in line with our Inflation Index.
Liquidity: Drying Up
As part of our analytical framework, we assess the health of the countries’ income statement via growth and inflation and the health of its balance sheet via liquidity. Below, we show our Liquidity Monitor, where we show our measures of the Liquidity Impulse coming from Policy & the Private sector. Additionally, we show the normalized growth of some of the major subcomponents in the heatmap: (please note our Private Impulse is a beta version)
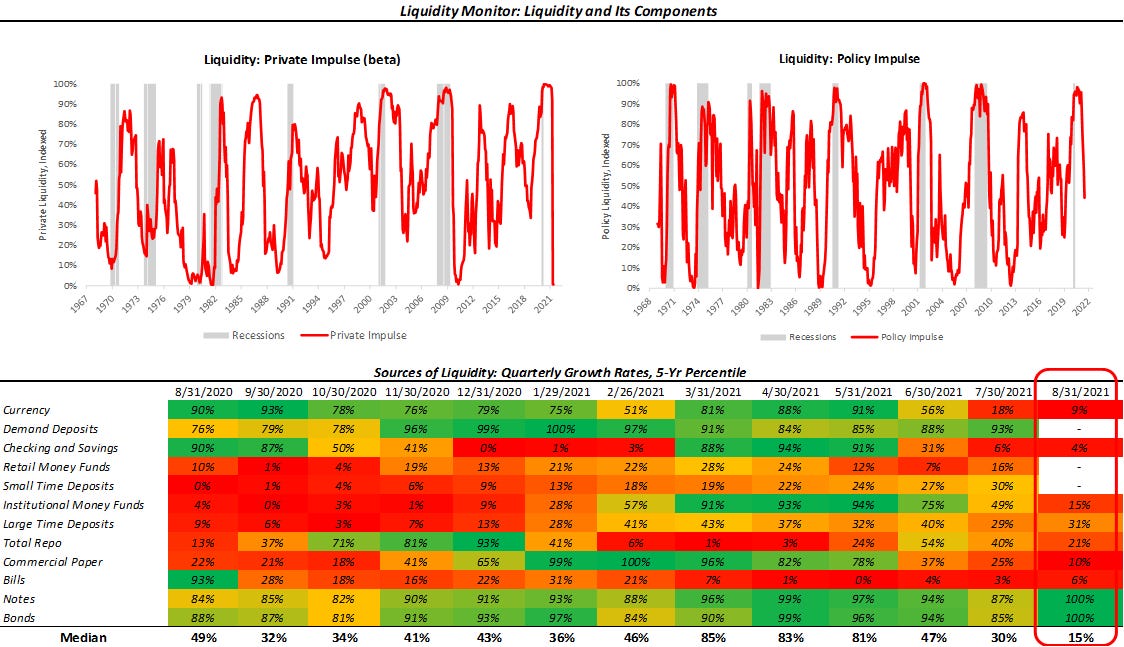
As we can see above, latest data imply a further weakening of the liquidity complex. With the notable exception of Treasury notes & bonds, major liquidity sources are showing sigfnicant slowdowns in their growth rates. As we have said in the past, the slowdown in liquidity growth is due to the fading effects of the joint monetary-fiscal stimulus during the depths of the pandemic— with these cash balances now migrating to other areas, i.e. the real and financial economy. This migration of cash to other avenues archetypically results the steepening of yield curves and the expansion of equity market valautions, which we have seen for the majority of 2021. We show this effect below via our Policy Impulse Index:
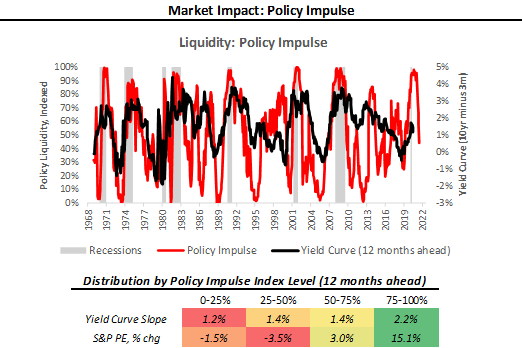
The Policy Impulse Index typically rises to precede steepening yield curves and richening valuations. This is because the Policy Impulse Index measures pristine liquidity coming from monetary and fiscal authorities, which form the base of capital that can migrate to risk-taking and economic growth. Today, the slowdown in liquidity growth essentially reduces the “dry-powder” available for the same process in the future. Therefore, the reduction in liquidity will eventually find its way into the financial assets and the economy, but likely with a lag. The implication of the current levels of the Policy Impulse is that we are likely to see flattening yield curves and lower PE ratios over the next 12-months. Given our systematic outputs on growth and inflation along with our discreionary view that the Fed could likely to reduce monetary accommodation during early-2022, we think 2022 could play out much like the taper analogue of 2013:
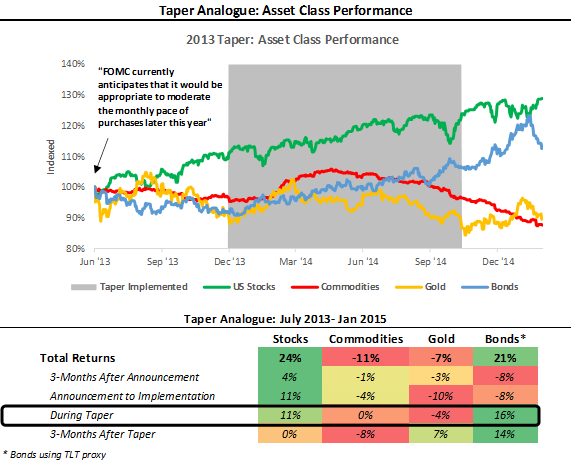
As we can see above, while bonds posted weak returns between announcement and implementation of the taper, they begun to perform strongly as liquidity was removed from the system (during taper). Our leading measures of Liquidty are telling us we could see a similar dynamic in early 2022.
Market-Implied Regime: (+) G (-) I Confirmed
Using the performance of various asset classes, we can extract what markets are implying which particular economic regime we are in. Below, we show what markets are telling us about the current growth and inflation regime:
As we have mentioned before, we can be in one of four regimes:
(+) G (-) I: Rising Growth, Falling Inflation
(+) G (+) I: Rising Growth, Rising Inflation
(-) G (+) I: Falling Growth, Rising Inflation
(-) G (-) I: Falling Growth, Falling Inflation
Using our understanding of asset markets, we can classify periods of time into one of the four regimes mentioned above. Further, we can use the regime obtained from our market-implied odds with trend-following and cross-sectional momentum measures to create portfolio signals. To provide maximum accessibility, we truncate the portfolio construction into three stages:
Asset Class Selection: We create a portfolio that selects asset class exposure based on the current market-implied regime.
Sector Rotation: We create an equity rotation portfolio that chooses sectors based on their market-regime preference- to avoid overfitting, we choose these logically rather than based on our historical regime performance.
Unlevered Portfolio: We combine Asset Class Selection and Sector Rotation.
Market Regime Portfolio: Finally, we create our Market Regime Portfolio by ex-ante targeting equity volatility, i.e., we use leverage to match equity volatility.
Below, we show the results of this process versus major asset classes. Additionally, we show the performance characteristics over the decades since the 1970s:

As we can see above, our systematic Market Regime Portfolio has a strong performance across measures and is consistent over time. The portfolio is designed to be decisive and aggressive, wholly allocating to assets that prefer the current regime, with no diversifying exposures. We take significant signal from our Market Regime Portfolio, which has now confirmed a (+) G (-) I environment , i.e. one that predominantly prefers equities. Our Market Regime Portfolio took its first loss since January last month, due to its waiting on signal confirmation to transition from commodity exposure to equity exposure, but has since transitioned aggressively to equities. Our systematic expectation is for (+) G (-) I to be the dominant environment over the next few months, but for the environment to become tougher heading into 2022:
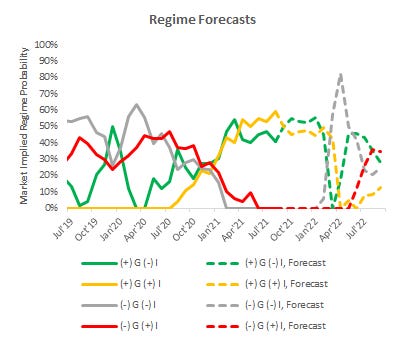
Therefore, our systems currently imply that the current environment will continue to support (+) G exposures, but equities more preferentially than commodities. We continue to monitor this situation carefully and will keep you abreast of changes in regime. We recommend you follow us on twitter (link here) as we provide more timely updates there on regime changes.
Conclusions: ?
To reiterate the signals coming from our systems:
Economic growth continues to trend lower. We expect this continue well into 2022, where we see the combination of elevated expectations and slowing growth rates creating a difficult environment, both from the perspective of economic data surprises and realeconomic support.
Inflation remains elevated and stable. Our measures of the broad impulse to inflation tell us that tomorrow’s print is likely to be weaker, but we expect inflation rates to remain elevated through 2021.
Liquidity continues to dry up. Our leading measures of liquidity imply that yield curves will flatten and PE ratios will cheapen over the next 12 months, potentially conicident with an exacerbating tapering of monetary accomondation.
Markets are now pricing (+) G (-) I dominantly. Our systems expect this to continue for the next few months.
Overall, the environment still looks positive for risk and (+) G exposures. However, ca confluence of signals seems to be emerging from our systems that imply that slowing growth, elevated inflation, liquidity shortages, policy tapering, and elevated expectations could create a tough environment during during late-Q1 or early Q2 of 2022. For now, we are in (+) G (-) I, but we think its always important to try and peer around the corner to prepare for what may be in store for markets. We will continue to keep you updated. Until next time.
Do you publish your Market Regime portfolio?