

Economic & Market Views

Today, we offer updates on our economic and financial near-casts, along with our market regime views. As always, we focus on what the economic data tell us about the economy’s current state, what markets tell us about expectations, and our systematic near-casting framework telling us about the near-term. Additionally, we show our Market Regime Portfolio, which applies our understanding of market-implied regimes and portfolio construction to give us a sense of the best exposures in the immediate term. Our observations are as follows:
Economic growth remains elevated. Our systematic near-casting of US economic growth puts US growth at approximately 3.5%, unchanged since our last publication. This high growth has surprised consensus expectations, leading to strong equity market performance. Our systematic forecasts imply that economic growth will begin decelerating more meaningfully in January.
Inflation is stable at high levels. Our comprehensive inflation measures continue to signal that inflation has stabilized at a high level. Our bottom-up systematic forecasts for headline CPI show us that there will likely be a solid and supportive undercurrent in the form of rising shelter costs. Our inflation impulse index points to inflation decelerating in 2022 but will stay elevated longer than growth.
Liquidity conditions are officially tighter. With the Fed tapering asset purchases, the policy impulse is going to deteriorate considerably. The question before markets is whether a combination of organic demand (fueling private cash balances) and market finance (fueling asset purchases) can fill the hole. It is a tall order.
Markets are pricing (+) G (-) I, i.e., rising growth and falling inflation. Markets have continued to reward exposures to pro-growth assets, i.e., equities and commodities. There has been back and forth regarding the inflationary nature of this rally, but markets have dominantly preferred (+) G (-) I assets over the last few weeks. We expect an eventual transition to (-) G in 2022, and to help better time this move, we show Momentum Monitor for bonds.
The future is dynamic, and our systems adjust as new information is available. Our bias is to allocate for the existing regime while trying to peek around the corner to what the future may hold. Our Market Regime Portfolio aims to capture the current macroeconomic trend, and our systematic forecasts serve as our way of estimating what the next trend is likely to be. Our Market Regime Portfolio has been well-positioned recently, benefitting from aggressive exposure to Consumer Discretionary, Tech, and Real Estate, taking cumulative performance up to 28% for the year. Our systems continue to point to pro-growth assets being well supported; therefore, maintaining such tilts in a portfolio is best.
Peering around the corner, our systems tell us a decelerating growth environment is likely to begin in 2022. Based on our understanding of markets, we expect this transition to showcase characteristically strong momentum in the bond market, both on an absolute and relative basis. To help better assess this move, we show our Momentum Monitor for bonds. Finally, to help prepare for future market moves, we showcase our systematic forecasts at the asset class level alongside our regime expected returns. We discuss all this in the pages that follow.
Economic Growth: Stronger Than Expected
Our Growth Index is our high-frequency measure of the growth impulse to GDP from a wide range of comprehensive economic data. The Growth Index has four subcomponents: risk premia, spending, production, and labor markets. The index measures economic activity at a higher frequency (monthly) and lower latency than quarterly GDP. Current economic data, which feeds the Growth Index, is currently pointing to 3.5% real GDP growth:
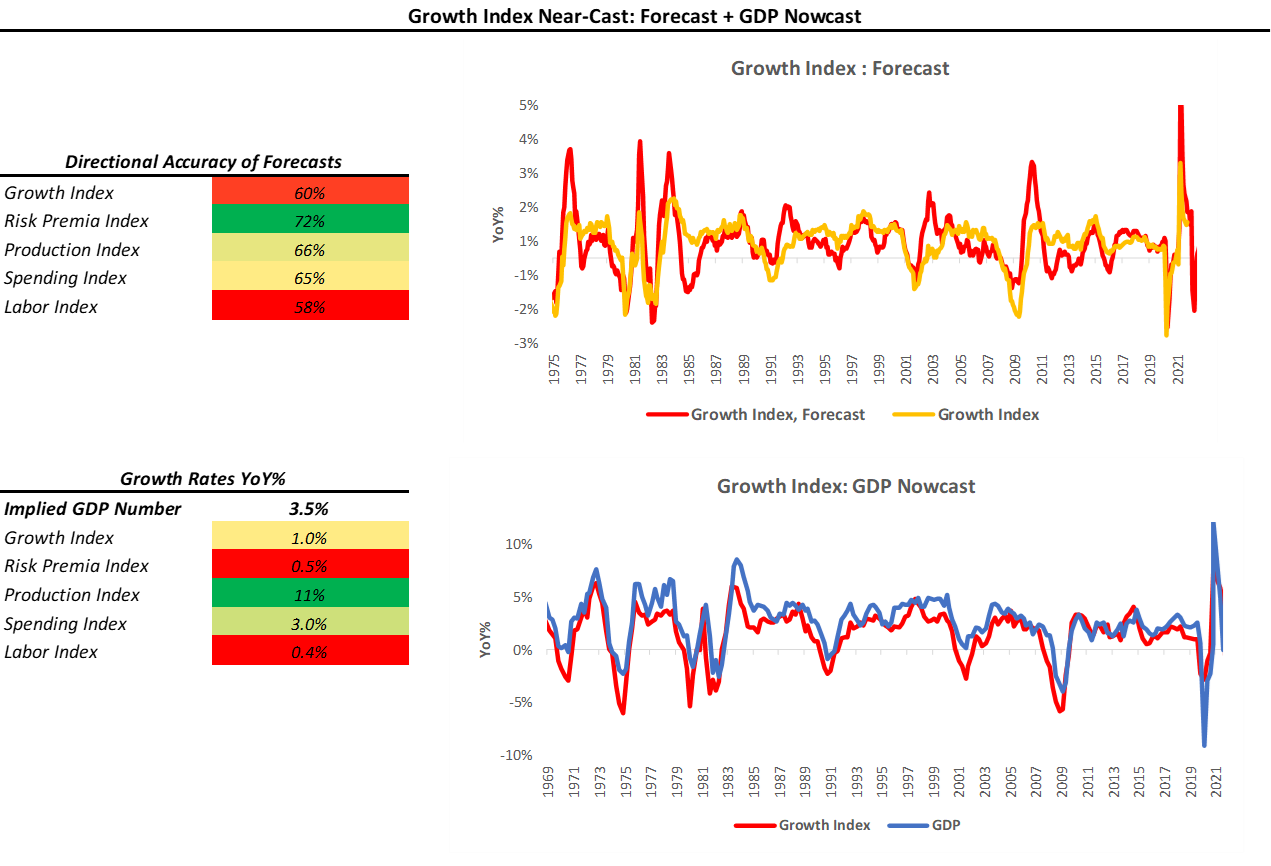
As we can see above, the Growth Index estimates real GDP growth in real-time. The Growth Index has a directional accuracy of 88% in nowcasting real GDP growth. More importantly, unlike many regression-fitted estimates, our Growth Index has greater accuracy in nowcasting GDP downturns- our downside directional accuracy is 95%. When we think about our Growth Index, we prefer to focus not on the estimated magnitude of the nowcast but rather the acceleration or deceleration of the nowcast. As we can see above, our Growth Index implies a GDP growth of 3.5% year-over-year, an increase since our last publication, at 3.4%. Additionally, we can break parts of the Growth Index into Sub-Indexes to show the distribution of economic forces:
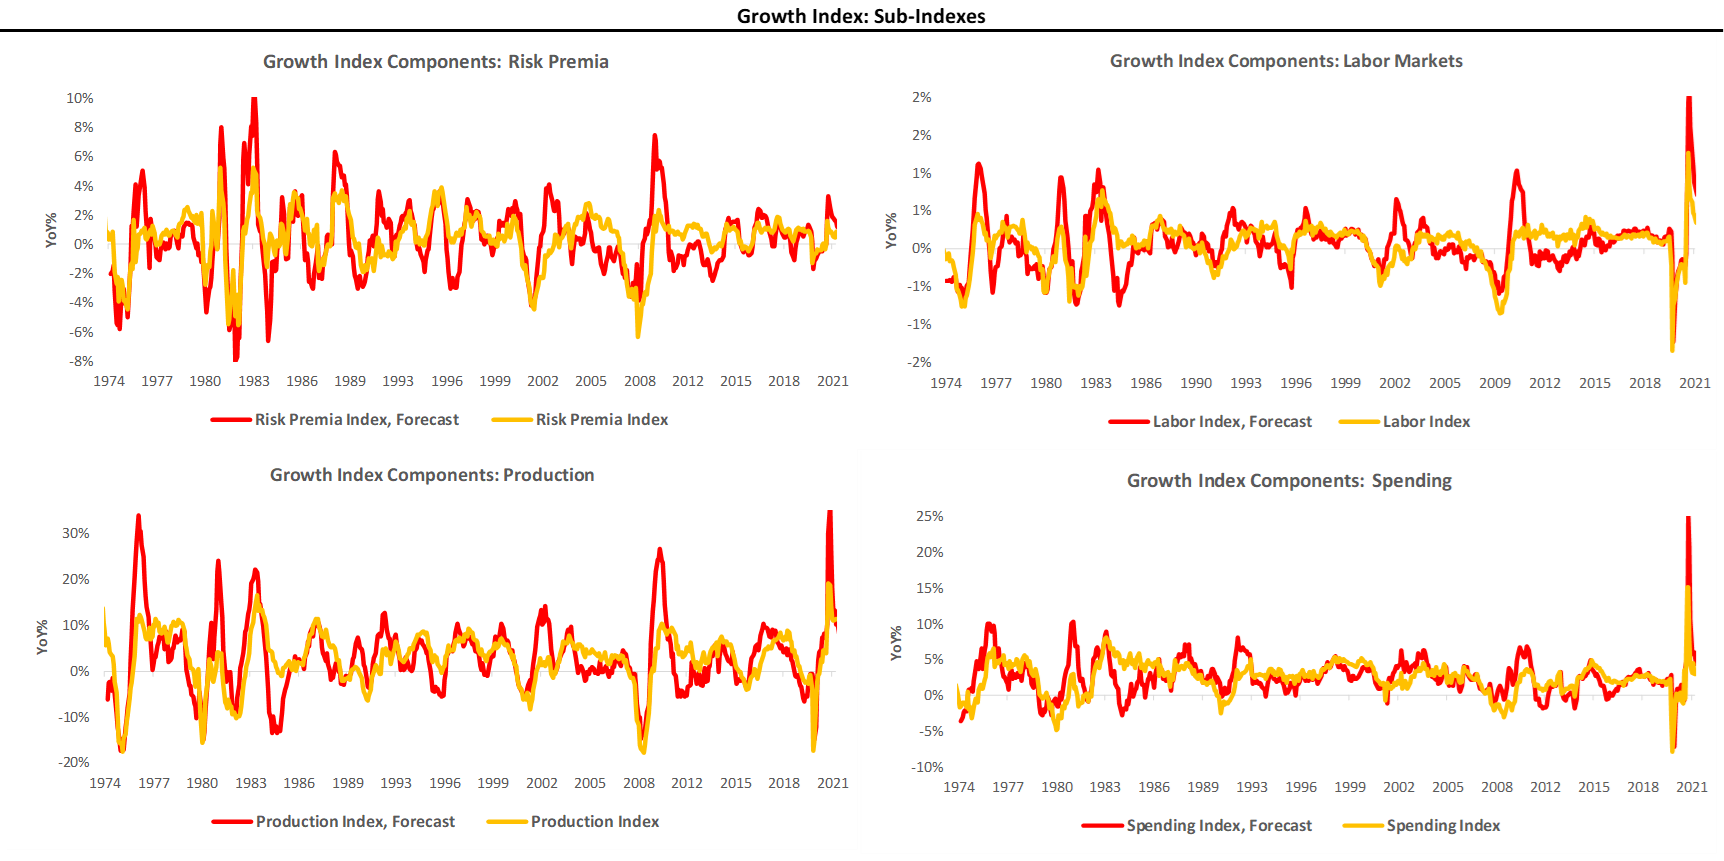
As we can see above, while economic growth does seem to be trending lower, there has been a slowing of the deceleration. This moderate uptick in GDP growth, from 3.4% to 3.5%, has surprised consensus estimates for economic growth. The combination of all this data has led to an environment where economic surprises are now above their historical mean:
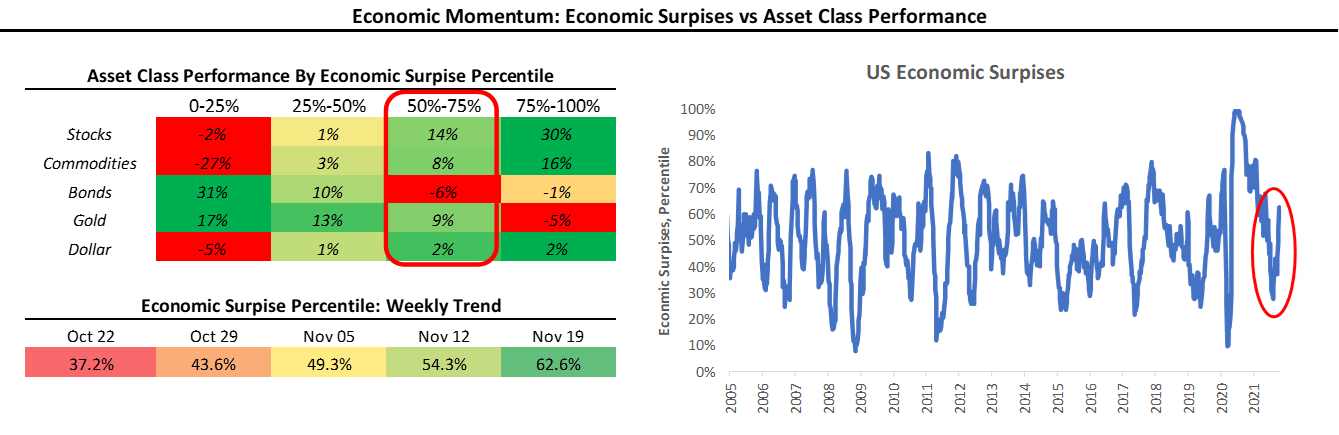
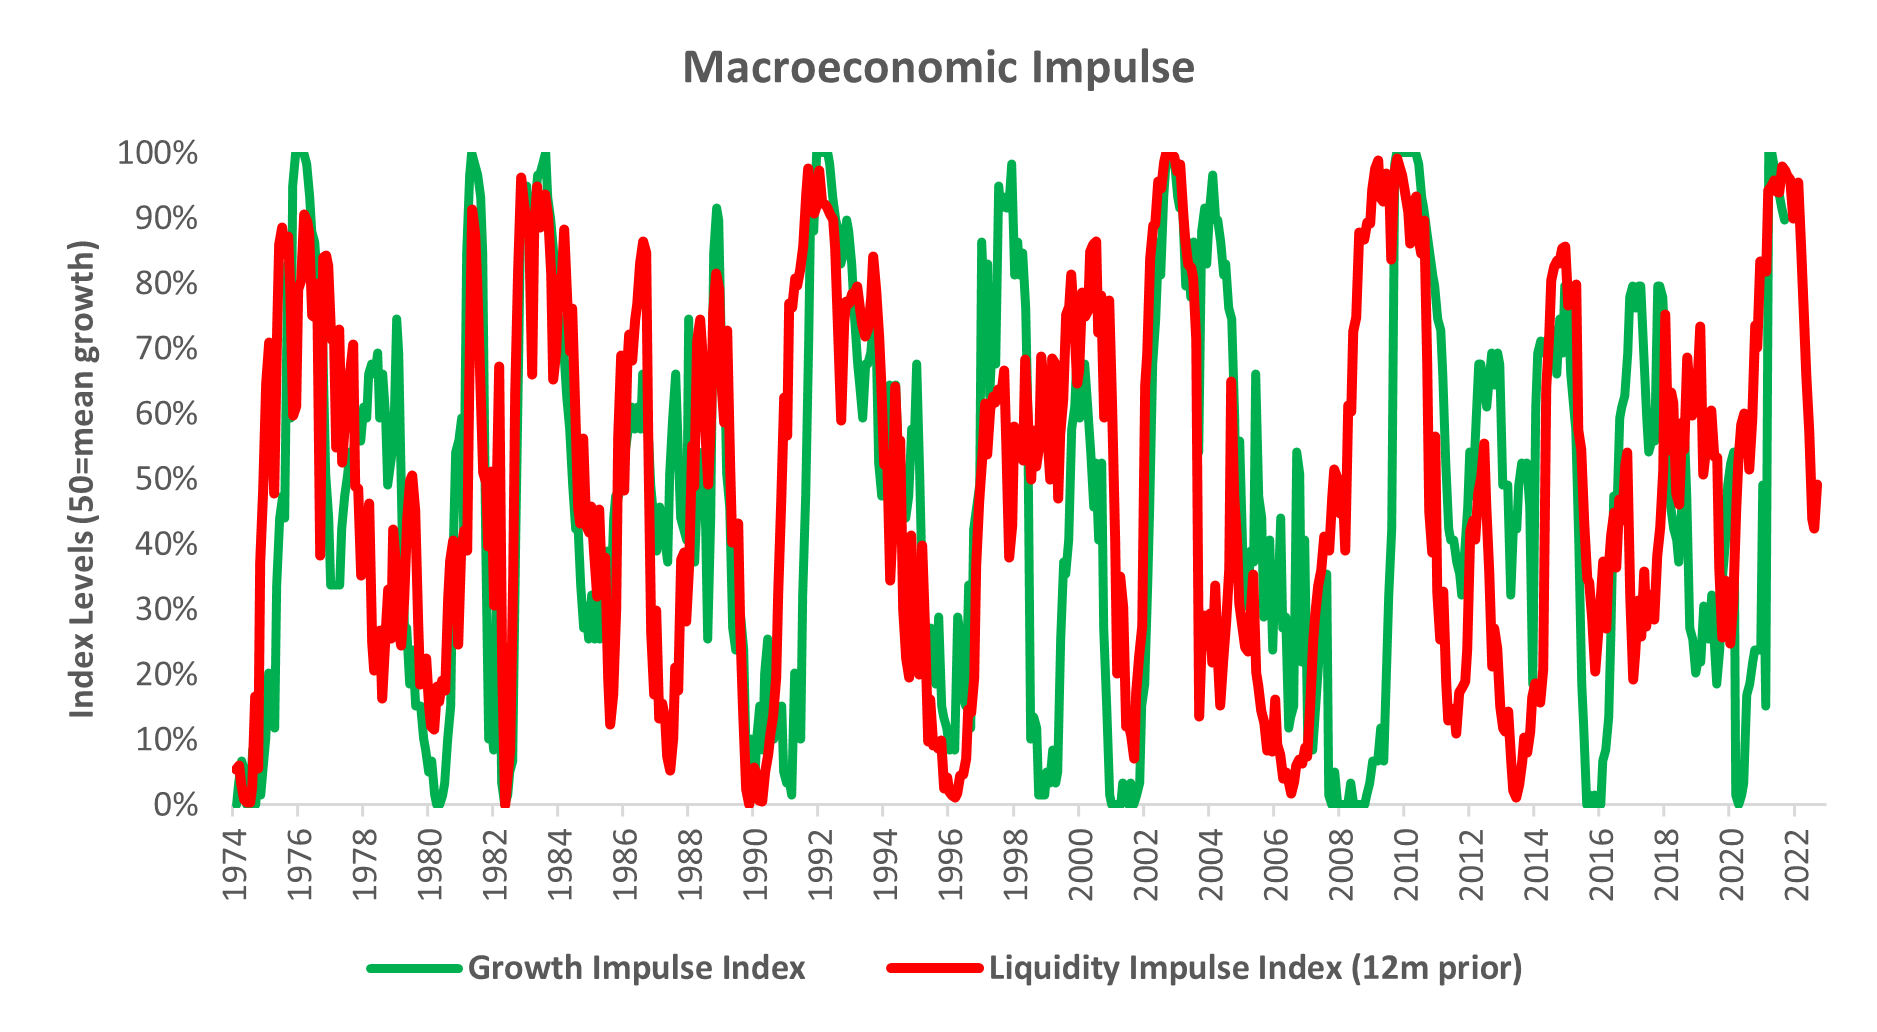
With the latest reading at 62.6%, realized economic data relative to expectations are in the second-highest historical quartile, an environment in which equities and commodities thrive and bonds are weak. Our systematic near-casts suggest that we can continue to remain in this environment a while longer, with the deceleration in the Growth Impulse Index only beginning in earnest in January of 2022:
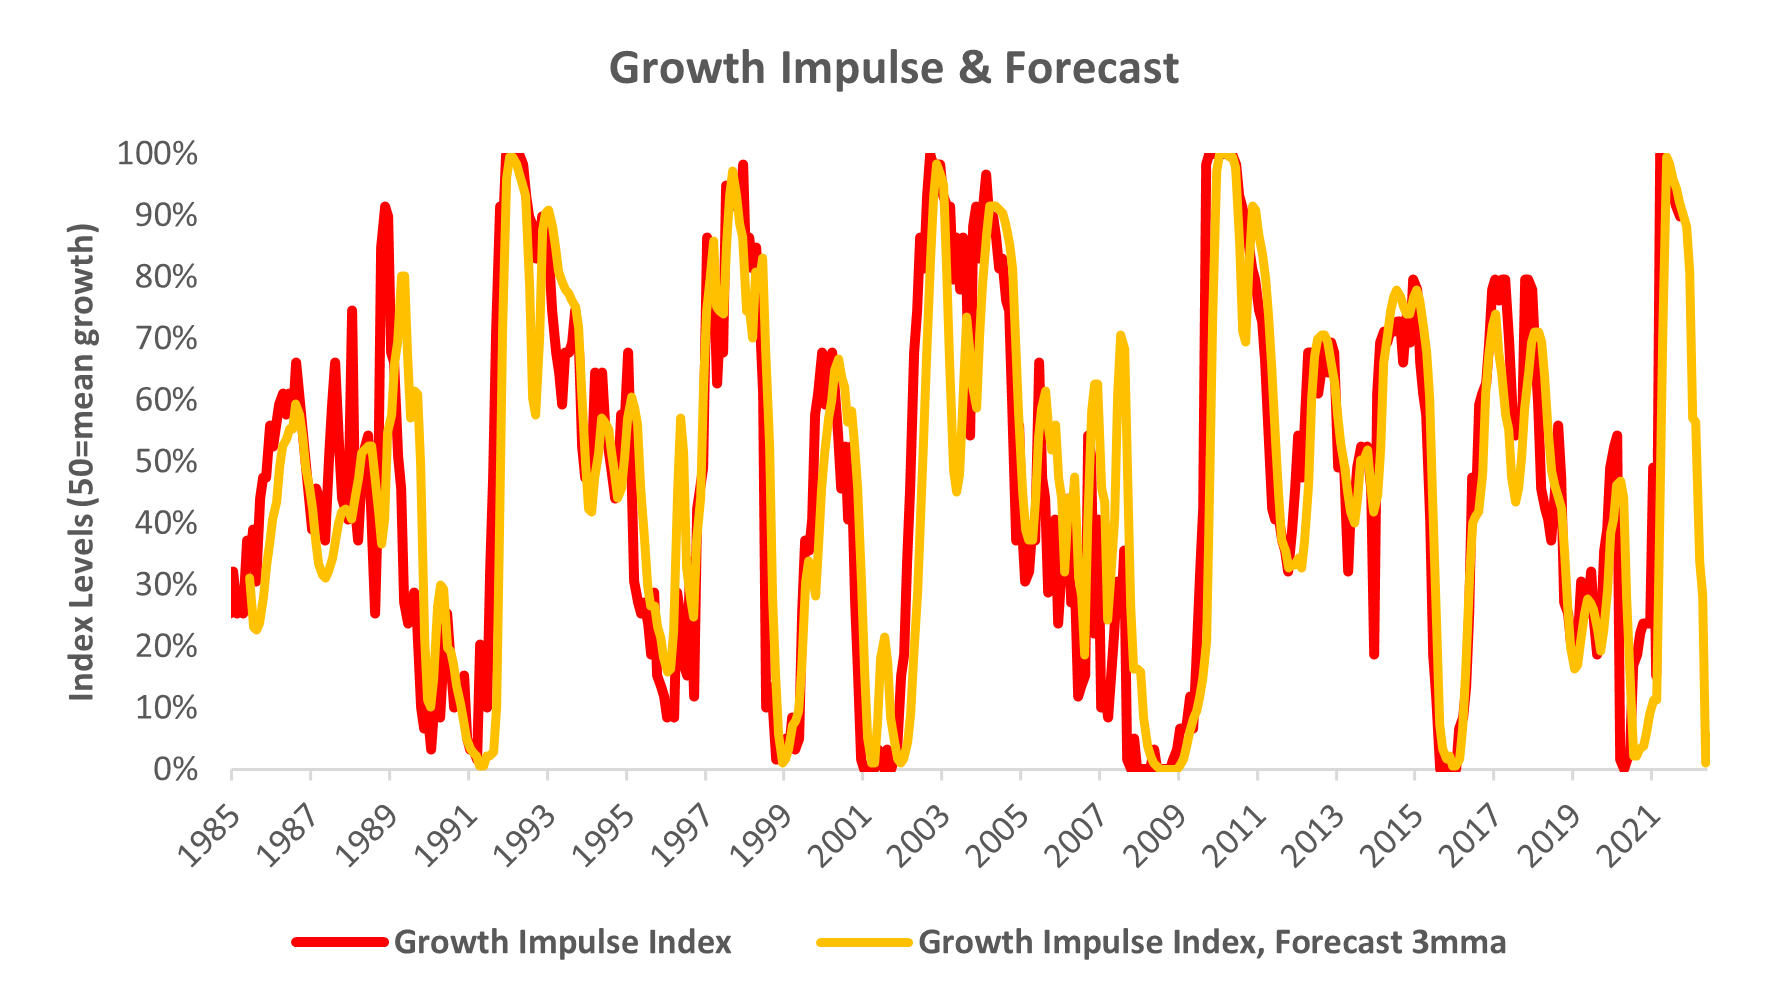
This forecasted slowdown in growth is confirmed by the decline in our Policy Liquidity Index, which typically leads economic activity by 6-12 months. Therefore, while we think the current market environment remains well-supported by elevated growth rates, there is increasingly less room for this to run.
Inflation: High And Stable
Our Inflation Index is our high-frequency measure of the impulse to inflation from a wide range of comprehensive inflation data. Our Index Index aggregates data across measures of Spending, Expectations, and Commodities to give us an understanding of the degree and pervasiveness of inflation. Further, our Inflation Index allows us to nowcast inflation on an ongoing basis, giving us some insight into upcoming CPI prints:
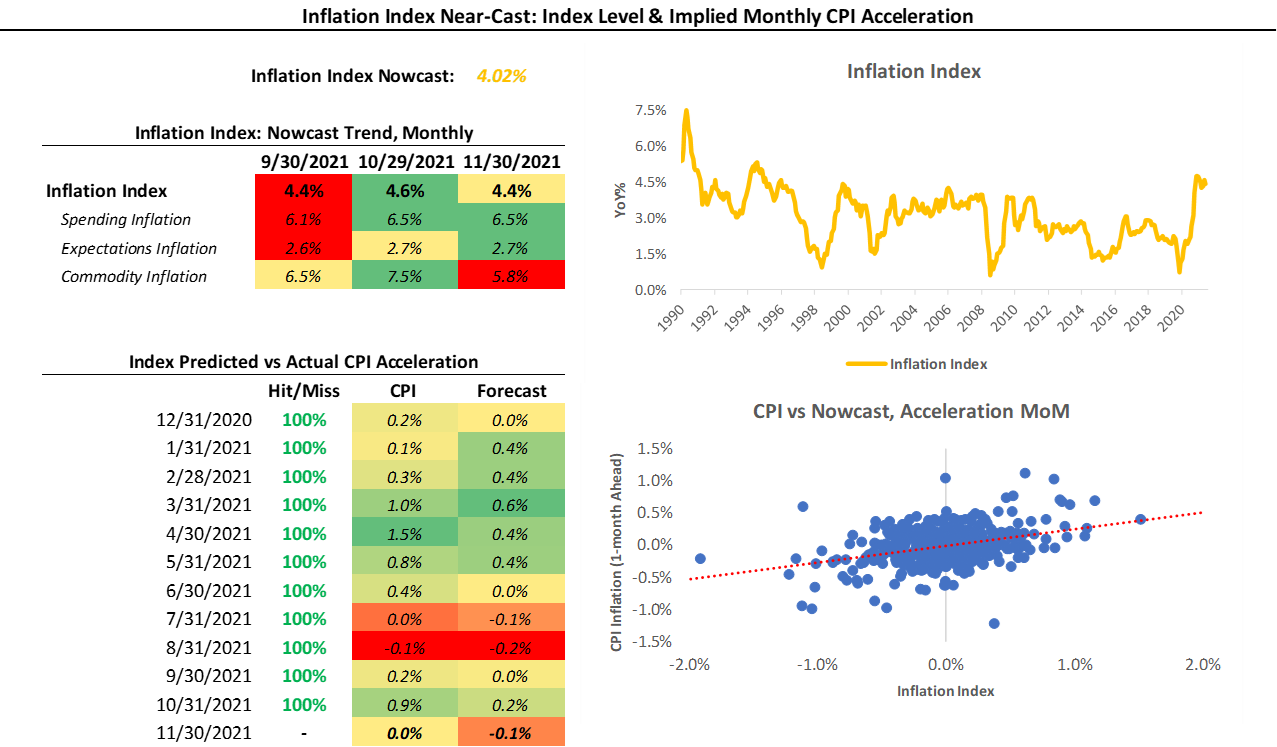
Our Inflation Index currently sits at 4.02%, essentially unchanged from our last publication. Our Inflation Index has been 58% accurate in determining the acceleration or deceleration of the following print in CPI since 1980. Over the previous 12 months, the Inflation Index has had a 92% accuracy in estimating the monthly acceleration in CPI. Given the recent accuracy of the Inflation Index, we take a considerable signal from its recent stabilization at higher levels. To complement the immediate-term view provided by the Inflation Index, we also offer our bottom-up systematic CPI forecast to estimate the future cyclical trend in inflation:
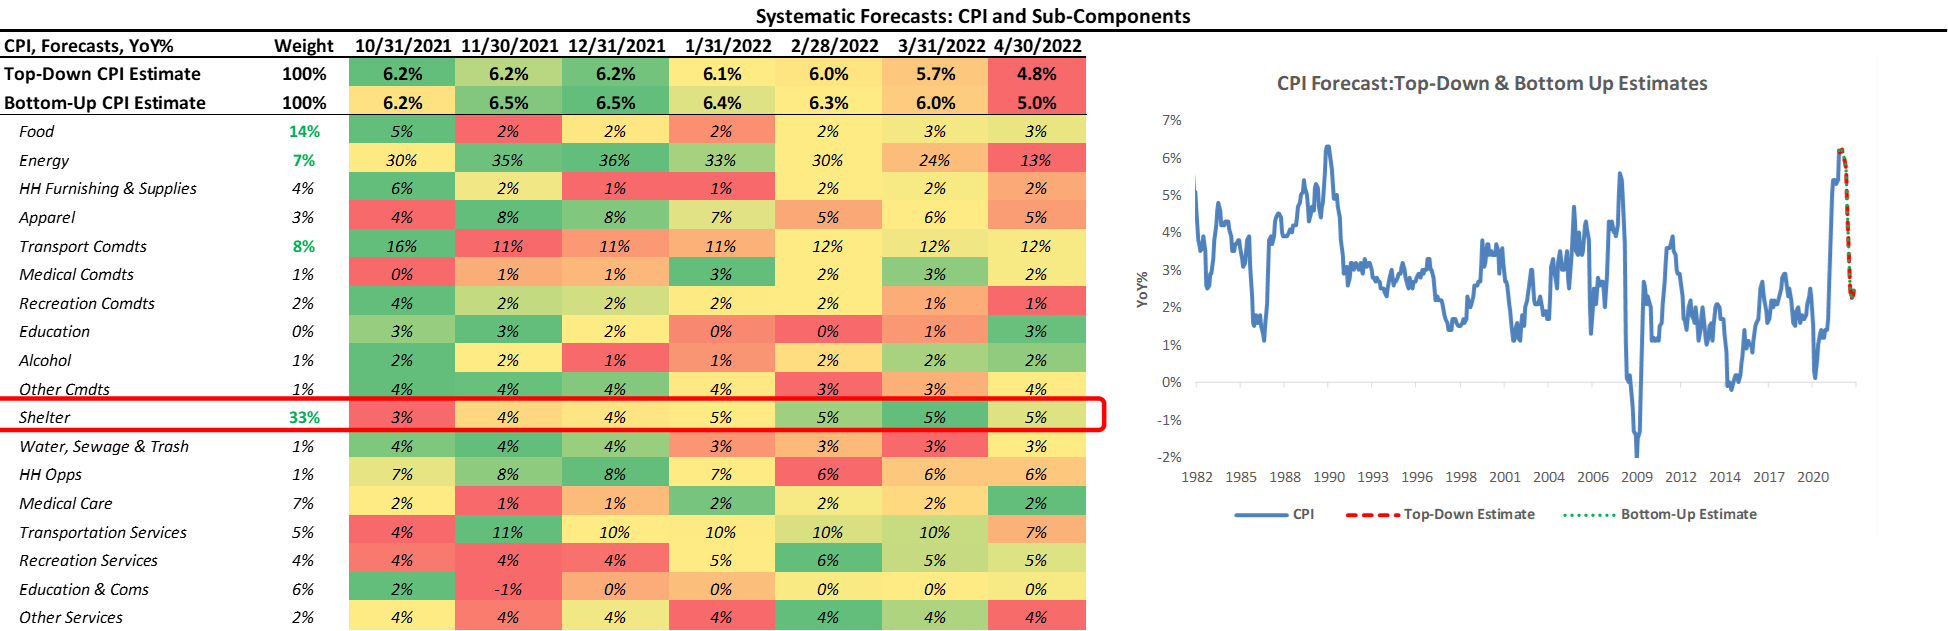
Furthermore, we see the potential for this elevated level of CPI to continue due to our bottom-up estimates for the Shelter component of CPI:
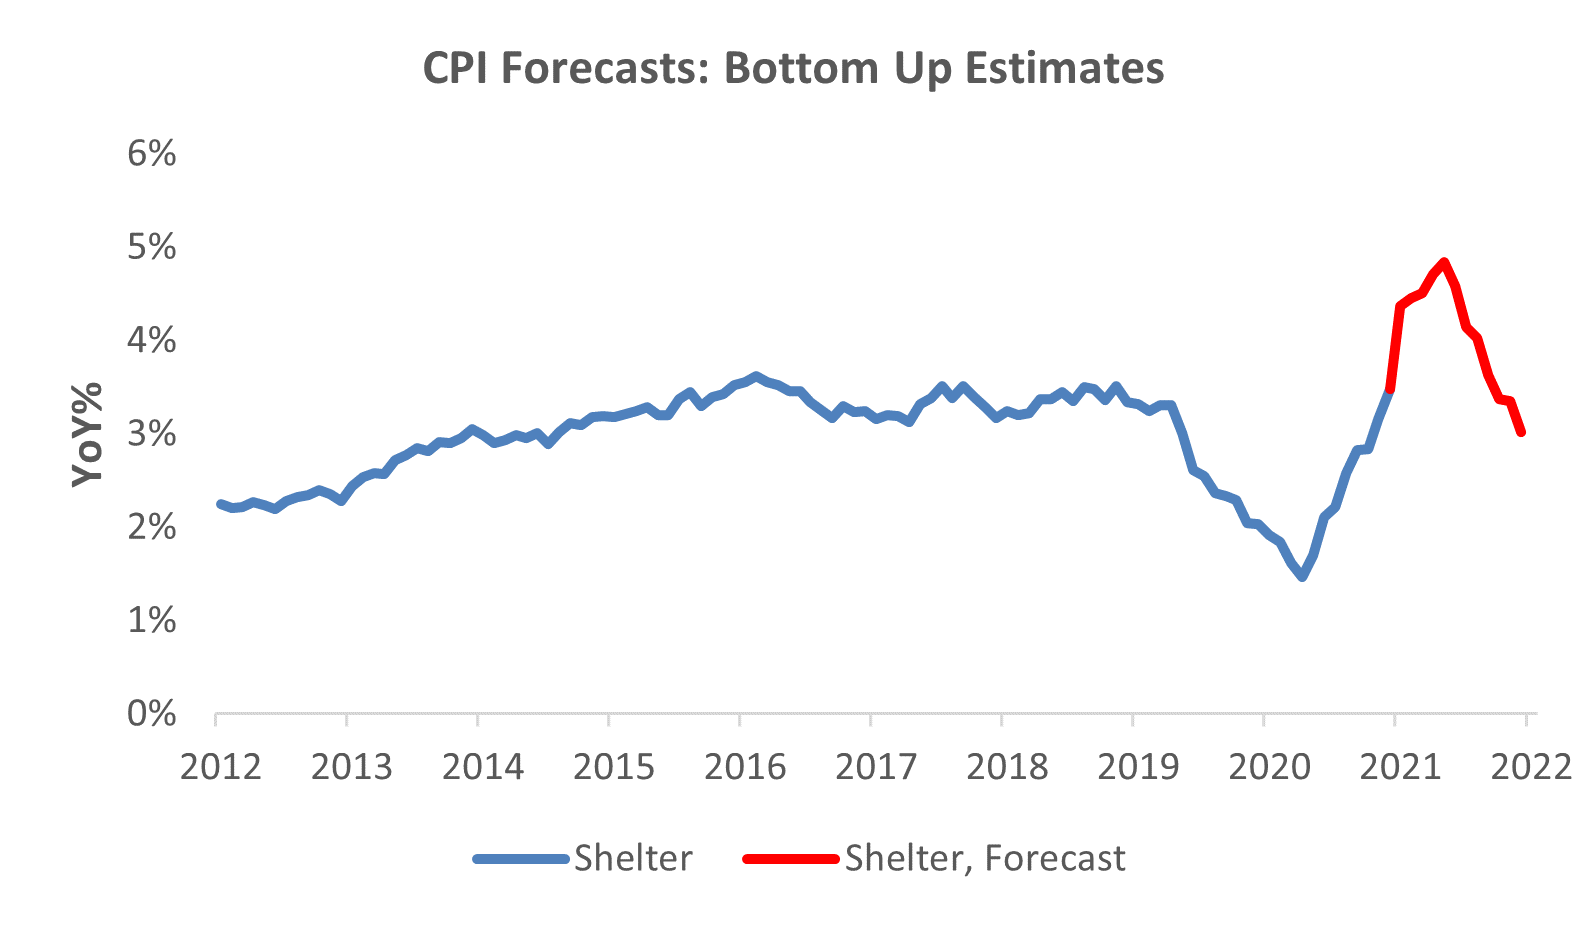
The shelter is the most significant component of the CPI basket, and our systems, alongside leading indicators of the shelter component, all point to higher inflation rates for shelter. Therefore, we think the underlying trend strength in inflation is likely to persist. However, our systems tell us that the worst inflation acceleration is behind us from a cyclical perspective. We show our systematic Inflation Impulse forecasts below:
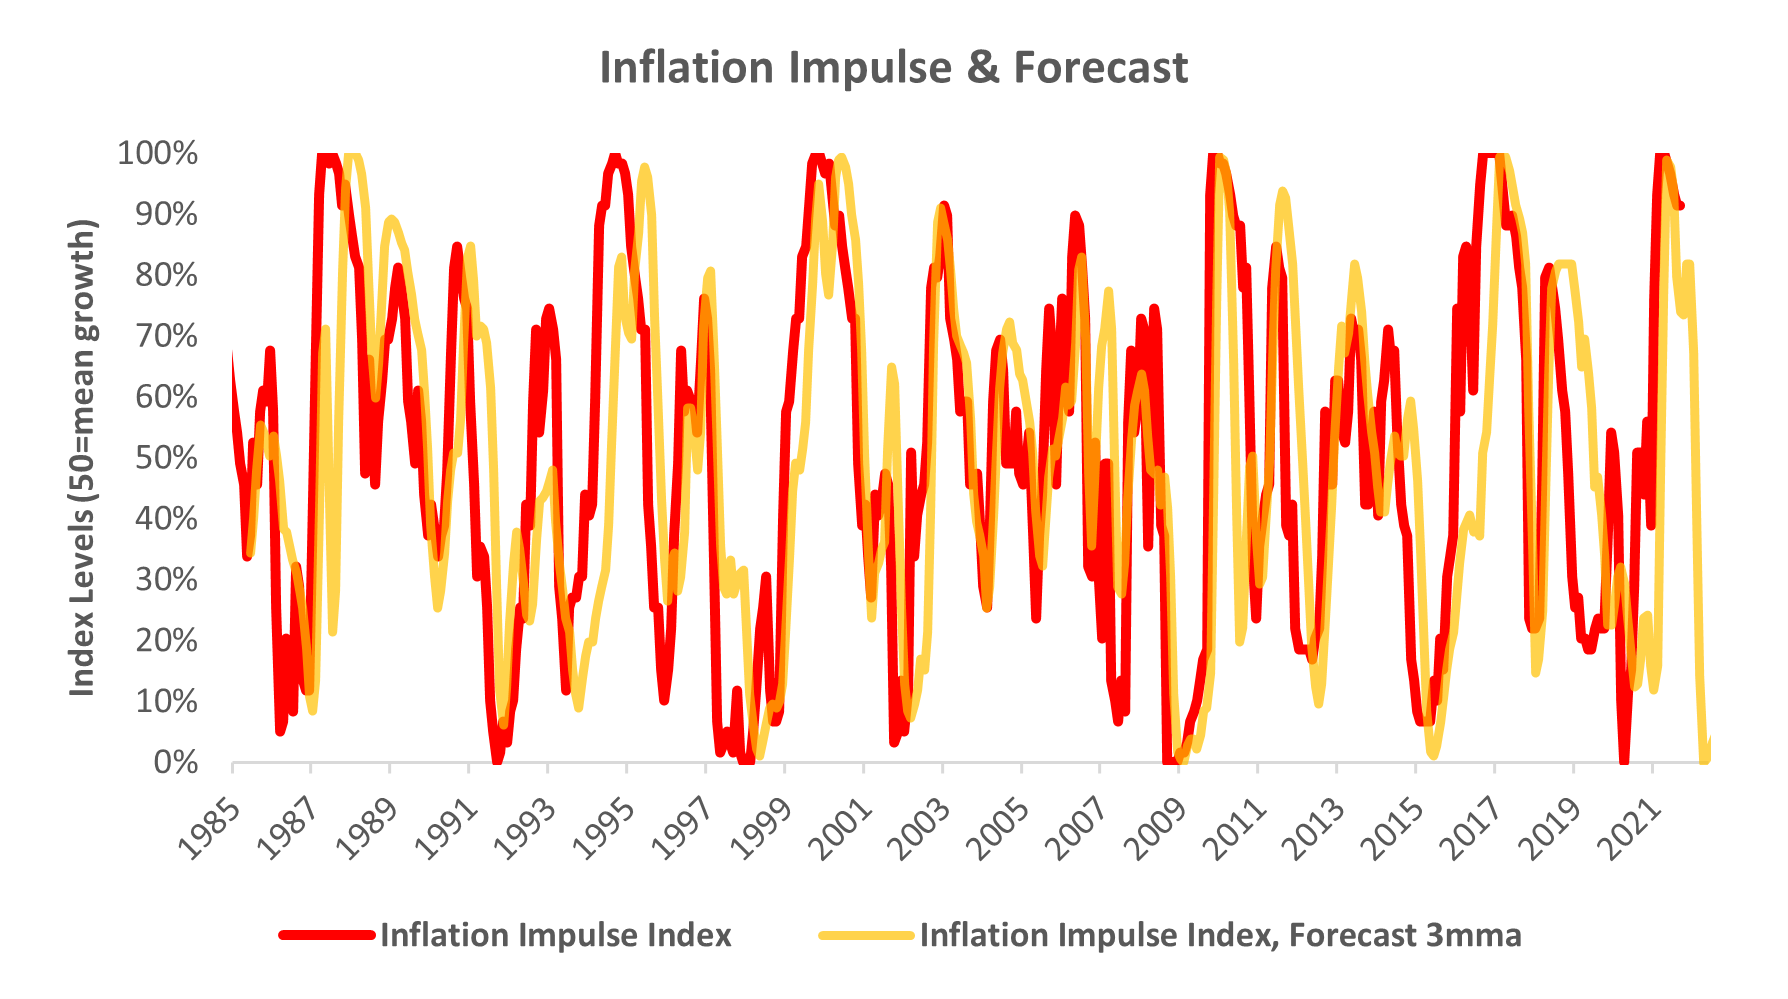
While our systems expect growth to decline in 2022, they also expect inflation to fall, but likely with a lag. We show this above. With regards to managing inflation risk, we reiterate:
“There has been (and continues to be) a debate on the underlying nature of inflation- i.e., whether the current strength in inflation is transitory. A significant component of this debate is the underlying secular dynamics that modulate inflationary pressures and underly cyclical moves in inflation. The question before us today is whether these secular dynamics have been altered in a way that changes the underlying inflationary trend to one that is higher than the pre-pandemic trend. We are still building the machinery to evaluate these underlying trends quantitatively; therefore, we remain hesitant to express views on the subject. However, from an empirical perspective, it is clear that the underlying trend has shifted higher. Therefore, we think it prudent to assess and evaluate inflation on a print-by-print cyclical basis.”
Our view remains that this is the optimal approach during an environment with a highly uncertain inflation outlook. Therefore, we will continue to monitor changes in inflation dynamics closely.
Liquidity: Can The Private Sector Fill The Hole?
As part of our analytical framework, we assess the health of the countries’ income statement via growth and inflation and the health of its balance sheet via liquidity. Below, we show our Liquidity Monitor, where we offer our measures of the Liquidity Impulse coming from policy & the private sector. Additionally, we provide the normalized growth of some of the major subcomponents in the heatmap: (please note our Private Impulse is a beta version)
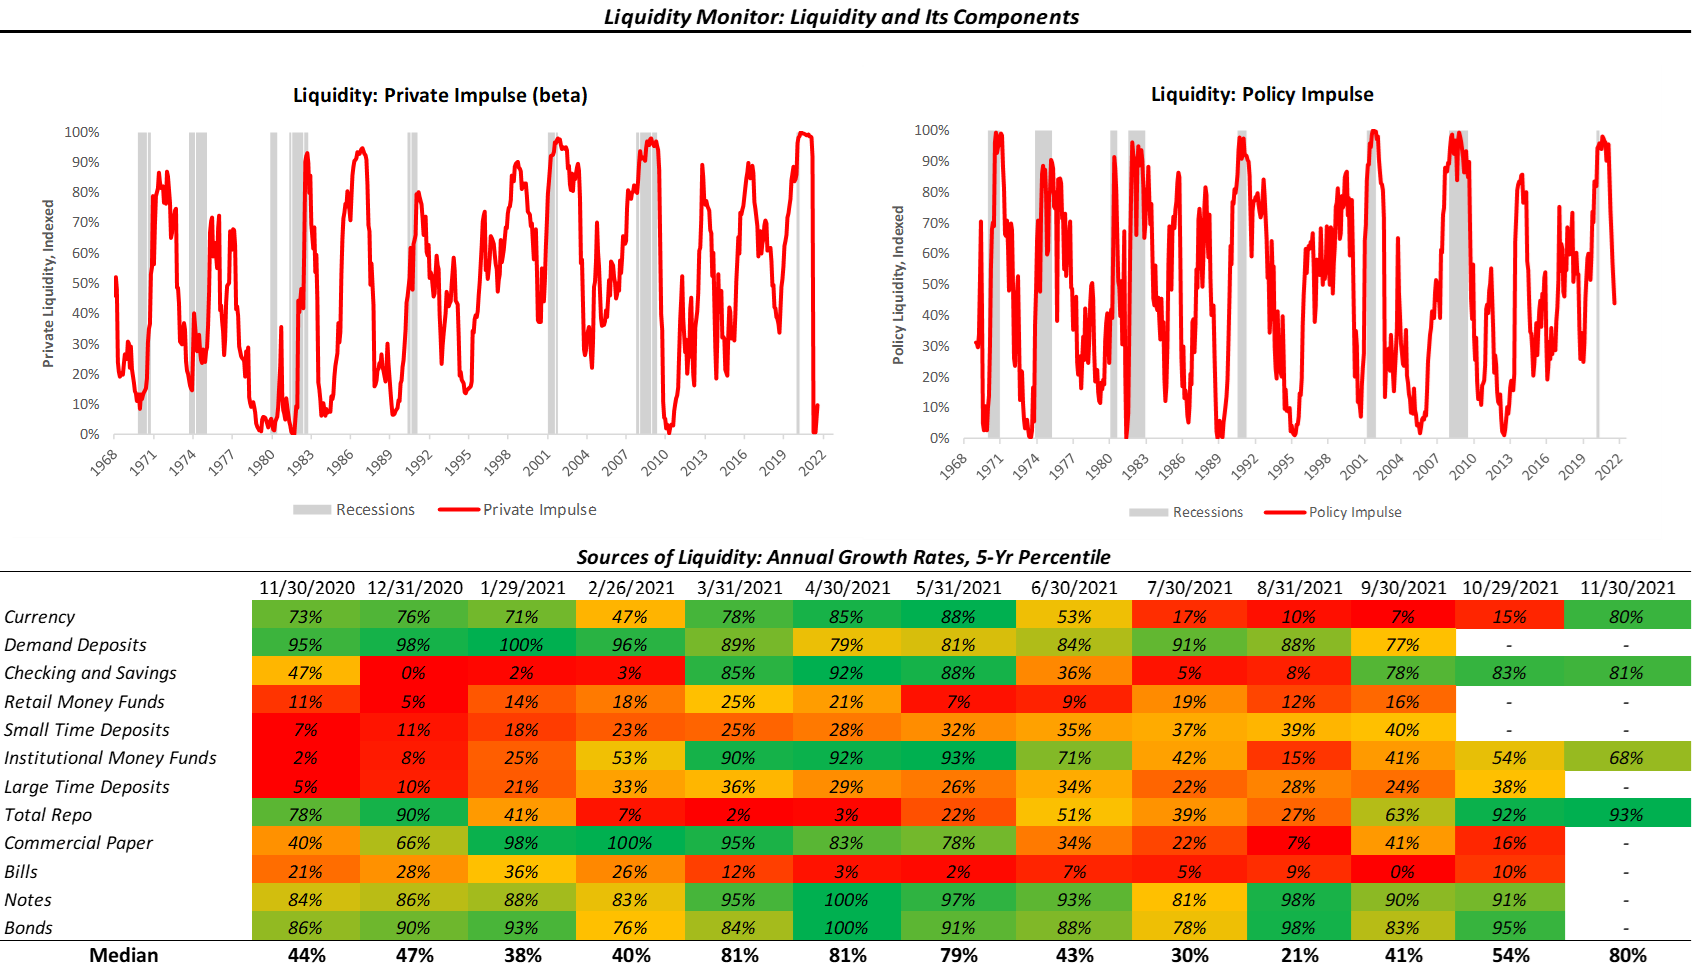
To offer further insight into the liquidity environment, we show some simply-sum measures of the aggregates above. For ease of reading, we show some of the simple-sum components of liquidity, grouped into Real Economy, Market Finance, and Government Finance:

Above, we see that private sector liquidity, both in the real economy and market finance, continues to expand. The question with regards to the liquidity outlook is two-fold. First, can the private sector organically increase cash balances to replace the impulse from fiscal programs? Second, can private sector market finance (repo, commercial paper, shadow banks) fill the hole created by the slow withdrawal of QE? Summarily, we think these are both tall orders and unlikely. Fortunately, the leading nature of liquidity precludes us from the need to forecast these variables. Further, our Policy Impulse Index has already turned lower, telling us that liquidity-based support for the economic expansion is already fading:
Additionally, as liquidity fades and economic growth (potentially) declines, the demand for high-quality assets and collateral rises, i.e., US bonds are increasingly in demand:
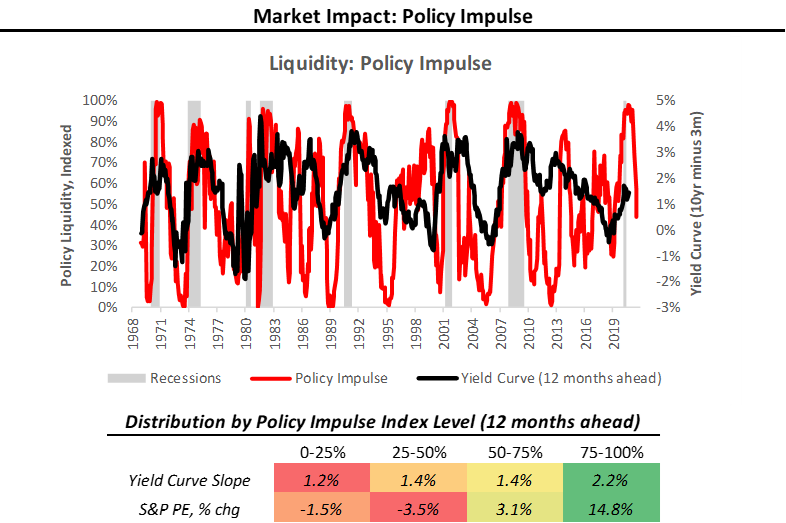
The Policy Impulse Index typically rises to precede steepening yield curves and richening valuations. This relationship is because the Policy Impulse Index measures pristine liquidity coming from monetary and fiscal authorities, which form the capital base that can migrate to risk-taking and economic growth. Today, the slowdown in liquidity growth essentially reduces the “dry powder” available for the same process in the future. Therefore, the reduction in liquidity will eventually find its way into the financial assets and the economy, but likely with a lag. In this environment, growth slows, valuations tighten, and bonds are relatively attractive. We expect these dynamics to drive the next regime change, which aptly brings us to our next section.
Market-Implied Regime: (+) G (-) I
Using the performance of various asset classes, we can extract what markets are implying which particular economic regime we are experiencing. Below, we show what markets are telling us about the current growth and inflation regime:
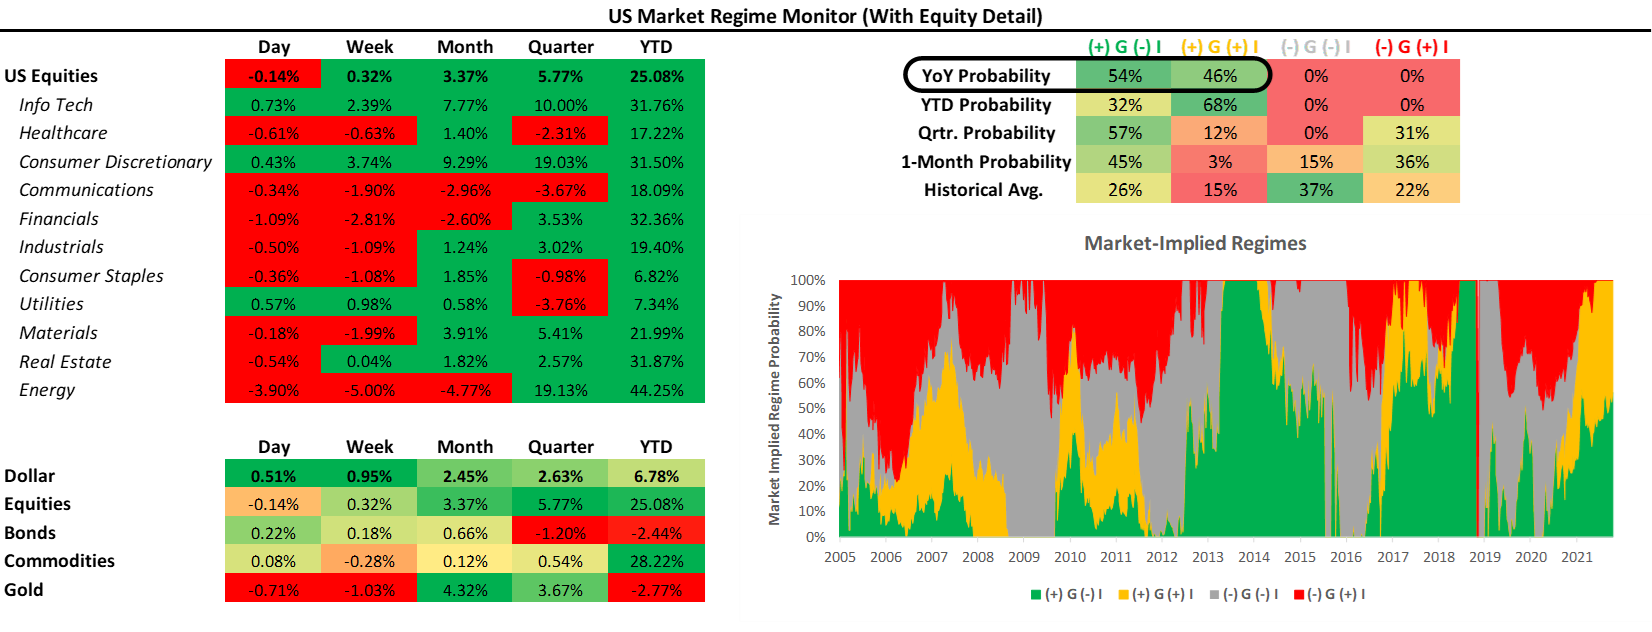
As we have mentioned before, we can be in one of four regimes:
(+) G (-) I: Rising Growth, Falling Inflation
(+) G (+) I: Rising Growth, Rising Inflation
(-) G (+) I: Falling Growth, Rising Inflation
(-) G (-) I: Falling Growth, Falling Inflation
Using our understanding of asset markets, we can classify periods into one of the four regimes mentioned above. Further, we can use the regime obtained from our market-implied odds with trend-following and cross-sectional momentum measures to create portfolio signals. To provide maximum accessibility, we truncate the portfolio construction into three stages:
Asset Class Selection: We create a portfolio that selects asset class exposure based on the current market-implied regime.
Sector Rotation: We create an equity rotation portfolio that chooses sectors based on their market-regime preference- to avoid overfitting, we choose these logically rather than based on our historical regime performance.
Unlevered Portfolio: We combine Asset Class Selection and Sector Rotation.
Market Regime Portfolio: Finally, we create our Market Regime Portfolio by ex-ante targeting equity volatility, i.e., we use leverage to match equity volatility.
Below, we show the results of this process versus major asset classes. Additionally, we offer the performance characteristics over the decades since the 1970s:
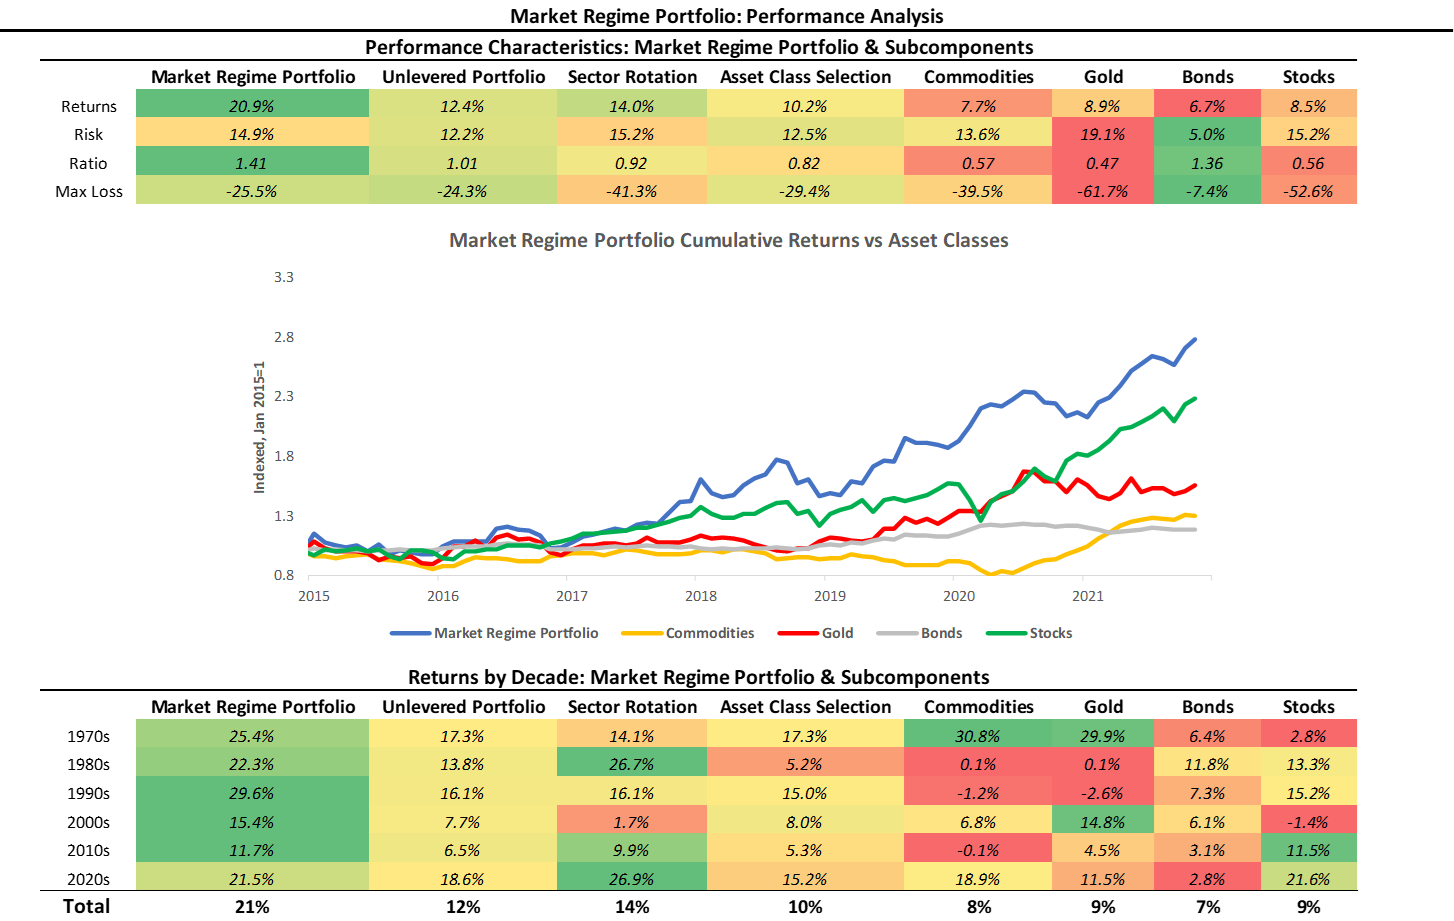
As we can see above, our systematic Market Regime Portfolio has a strong performance across measures and is consistent over time. The portfolio is designed to be decisive and aggressive, wholly allocating to assets that prefer the current regime, with no diversifying exposures. Currently, markets have been dominantly pricing (+) G (-) I, i.e., rising growth and inflation, and while we may shift back to (+) G (+) I, we think that the (+) G part will hold steady in 2021. While our Market Regime Signal helps us understand the current market trend, our systematic forecasts attempt to peer around the corner into the next regime:
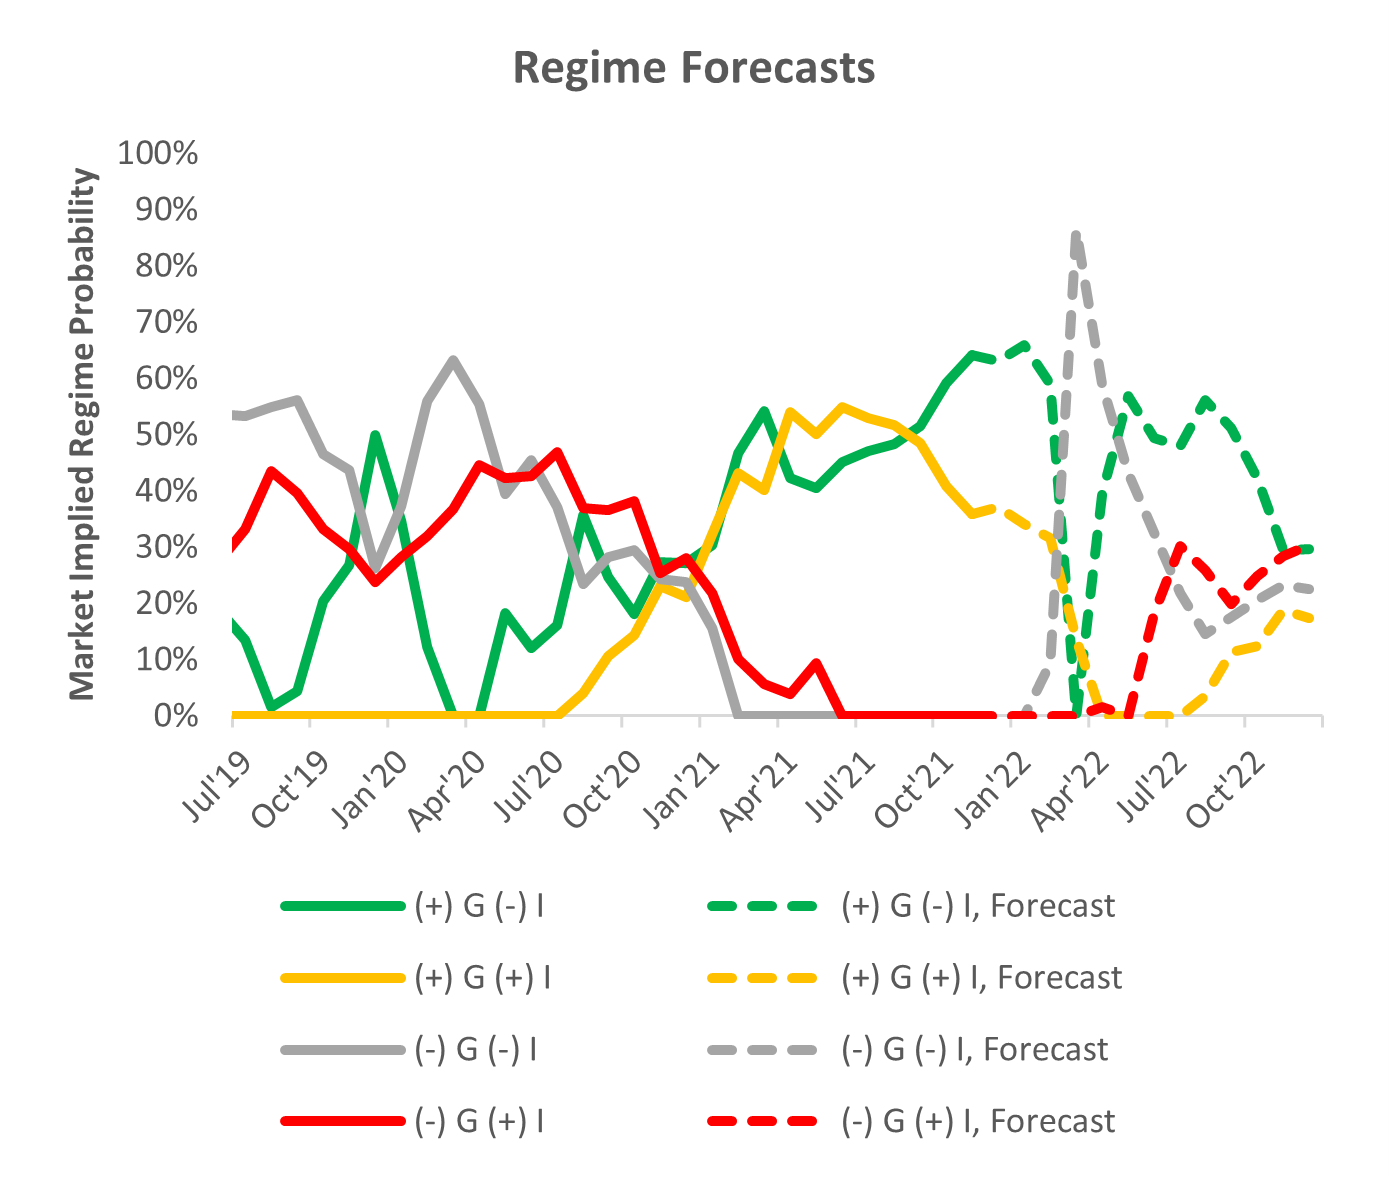
Consistent with our growth and liquidity analysis, we see that our systems indicate that the next regime is likely to be (-) G (-) I, i.e. slowing growth and inflation. In this environment, bonds are likely to show strong price momentum, both on an absolute and relative basis and gold could be bid as well. Indeed, this would be a considerable change to market pricing, and if the extent of this shift is significant, we could see considerable weakness in equities and commodities. To offer the full menu of options in a regime change, we show our historical regime analysis below. We circle the most likely regimes:
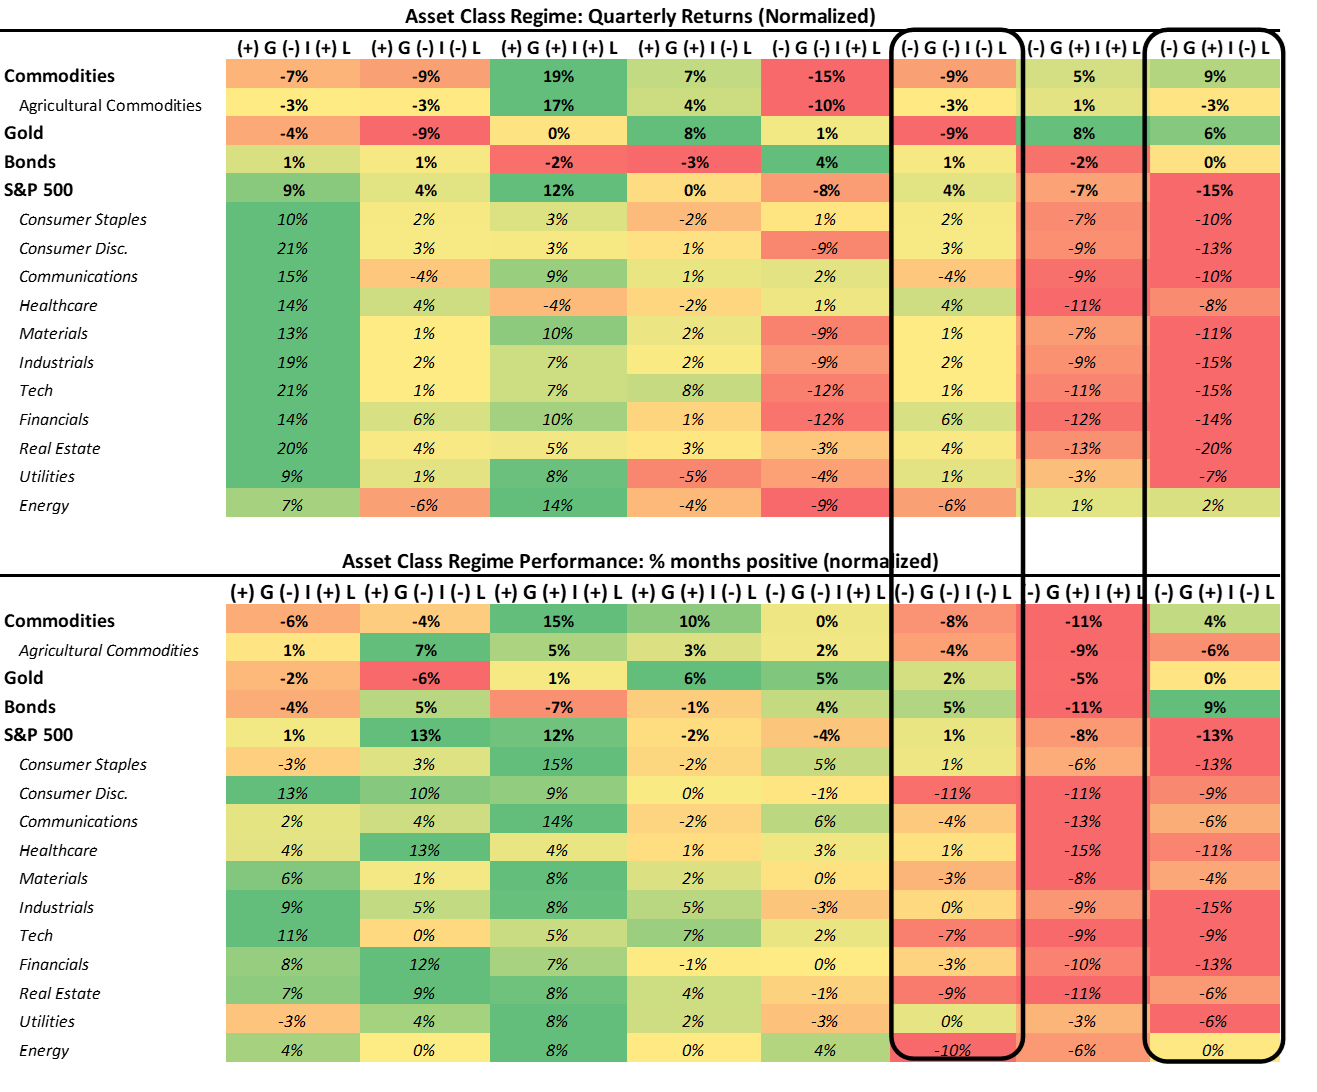
As we can see above, bonds offer an attractive proposition during a slowing growth and liquidity regime in quarterly returns and months positive. Given the centrality of bond market trends to this shift, we think it critical to monitor price action. To optimize our timeliness in prospective pivots, we offer our Momentum Monitor:
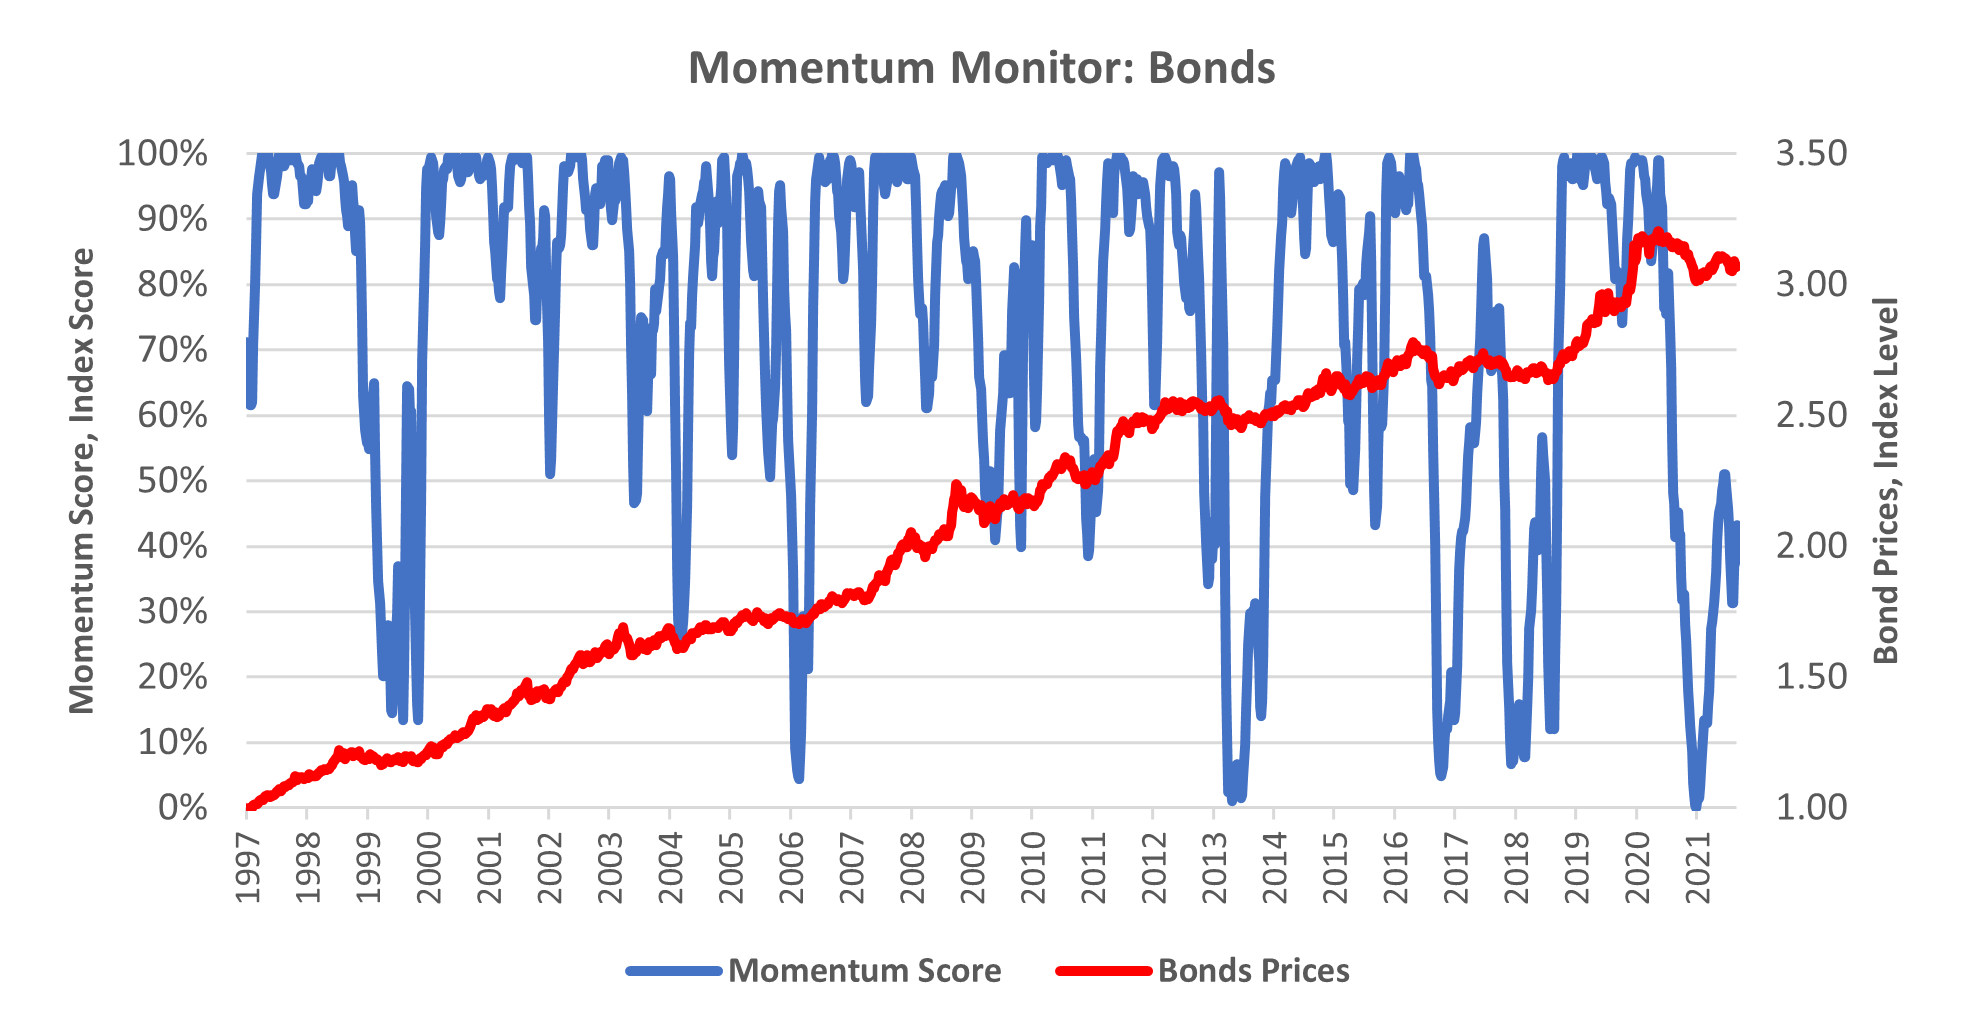
Our Momentum Monitor uses a multi-durational approach to momentum, allowing us to better assess changes within our Market Regimes. Our Momentum Score for bonds currently falls far below the level where markets could begin to price a falling growth regime. Therefore, we continue to think rising growth exposures to equities (tech, consumer discretionary, and real estate) continue to be warranted, but we are monitoring closely.
Conclusions:
To reiterate the signals coming from our systems:
Economic growth remains elevated and has recently surprised to the upside. Our systems continue to expect growth to trend lower.
Inflation is stable at high levels. Our bottom-up systematic forecast point to strong support from shelter.
Liquidity conditions are officially tighter. This tightening reduces the dry powder for growth and risk-on, which will likely catalyze the next regime shift.
Markets are pricing (+) G (-) I, i.e., rising growth and falling inflation. Our signals are aligning towards a regime shift, but our timing indicators tell us we are still far from a meaningful change in market trends.
Overall, (+) G exposures are still well supported by growth, inflation, & liquidity— resulting in a risk-on environment. We think that rising growth exposures (S&P 500, Tech, Consumer Discretionary, Real Estate, & Commodities) will continue to benefit from this environment. As we head into a more challenging environment in 2022, we continue to monitor market trends to help signal a regime change. We will keep you updated as our signals evolve. Until next time.