

Economic & Market Views
Economic & Market Views
Elevated growth and inflation?

Today, we offer updates on our economic and financial near-casts. As always, we focus on what the economic data tell us about the economy's current state, what markets tell us about expectations, and our systematic near-casting framework telling us about the near-term. Additionally, we show our future estimates for various asset classes, blending our systematic near-casting framework and historical regime expected return analysis. Our observations are as follows:
Current economic data points to robust growth but a sequential slowdown in year-over-year growth rates. Our Risk Premia Index and Spending Index contributed to the slowdown; however, our Labor Index and Production Index continued to post new highs.
While the liquidity outlook has changed, liquidity remains accommodative. The Federal Reserve has hinted that it may begin to taper asset purchases sooner than previously expected, changing our liquidity outlook. For the time being, our liquidity monitor points to liquidity conditions still being accommodative.
Our systematic forecast points to inflation peaking this month. We decompose CPI into its constituent categories and show our expected path for CPI and its subcomponents. Our discretionary analysis aligns with our systematic forecasts, leading us to think CPI will remain elevated through this year.
Markets are starting to price (-) G (-) I, i.e., slowing growth and inflation. The market-implied odds of a slowing growth environment have increased significantly over the last month. This is consistent with our systematic economic forecasts, albeit earlier than we expected.
Finally, we combine our systematic forecasts for the economy and markets, our discretionary outlook for liquidity, and historical regime analysis to understand the prospective path of major asset classes. Based on this triangulation, we programmatically estimate that the best asset class for a (-) G (-) I (-) L environment will be equities, and the worst asset class will be gold. We discuss all this in the coming pages.
Economic Growth Continues To Slow
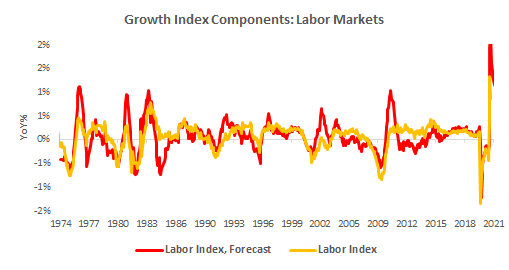
Our Growth Index is our high-frequency measure of the growth impulse to GDP from a wide range of comprehensive economic data. The Growth Index has four subcomponents: risk premia, spending, production, and labor markets. The index measures economic activity at a higher frequency (monthly) and lower latency than quarterly GDP. Current economic data, which feeds the Growth Index, is currently pointing to robust real GDP growth:
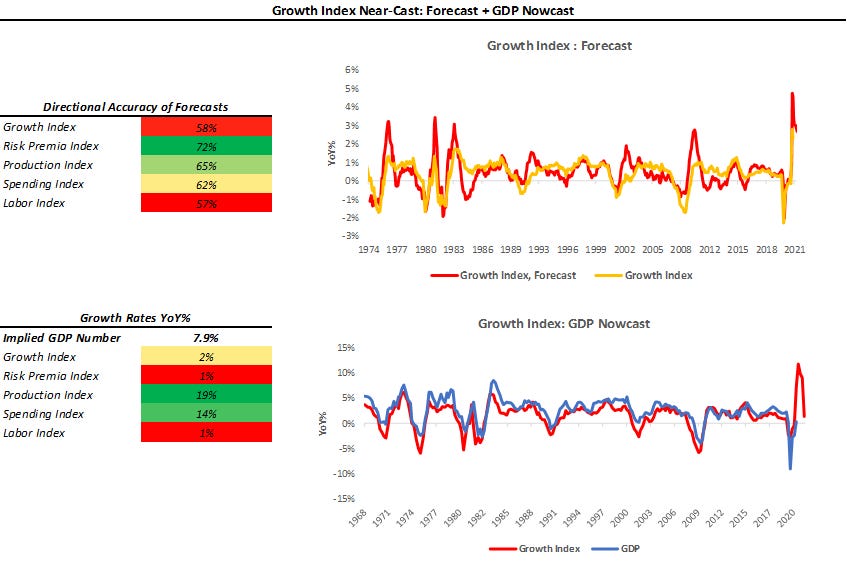
As we can see above, the Growth Index does a good job of estimating real GDP growth in real-time. The Growth Index has a directional accuracy of 88% in nowcasting real GDP growth. More importantly, unlike many regression-fitted estimates, our Growth Index actually has greater accuracy in nowcasting GDP downturns- our downside directional accuracy is 95%. When we think about our Growth Index, we prefer to focus not on the estimated magnitude of the nowcast but rather the acceleration or deceleration of the nowcast. As we can see above, our Growth Index implies GDP growth of 7.9% on a year-over-year basis, a slowdown since our last publication where it was at 8.1%. We take this to confirm further our view that the peak in economic growth rates is behind us. Nonetheless, we think there is still room for the labor market to improve, which will support economic growth at high levels:
Overall, we see growth stabilizing at higher levels for the rest of the year, though not accelerating further.
Liquidity: Negative Outlook, Positive Actual
As part of our analytical framework, we assess the health of the countries’ income statement via growth and inflation and the health of its balance sheet via liquidity. Below, we show our Liquidity Monitor, where we show our measures of broad liquidity, along with a heatmap with its major constituents:
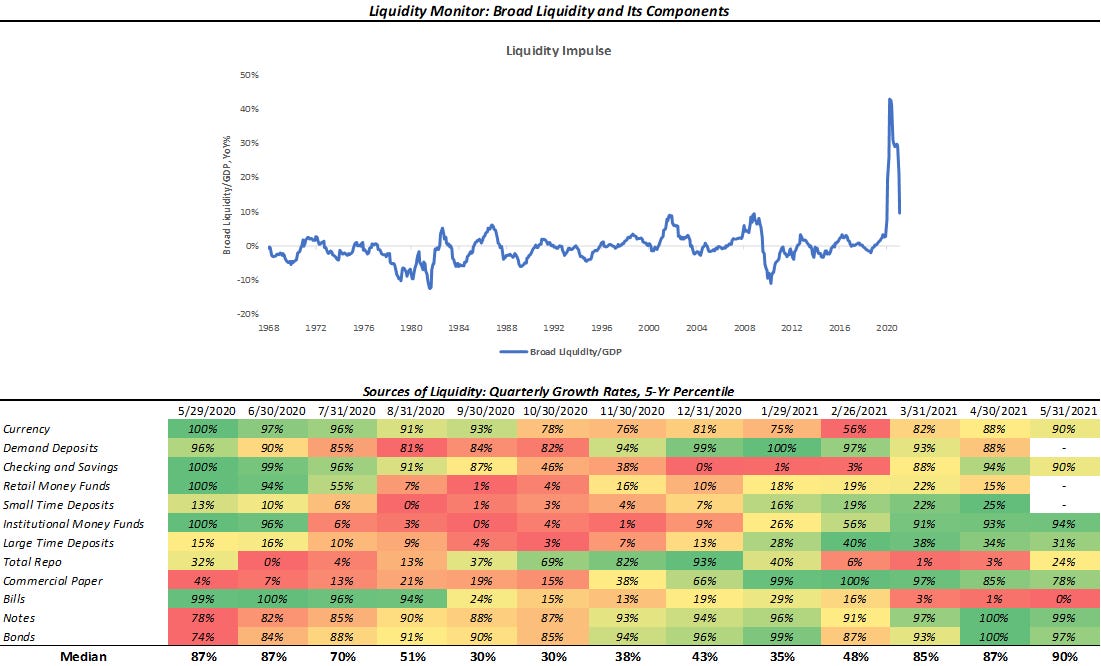
While this is indeed a beta version of our Liquidity Index (coming soon), we think it is important to bring you our insights in a timely fashion. Liquidity shot upwards last year on the back of unprecedented monetary and fiscal support to the economy. Therefore, we see a weakening in year-over-year growth rates as liquidity growth normalizes relative to GDP. Looking at the underlying detail in the table above, we see that most liquidity components show strong growth relative to their history. However, Treasury bill issuance continues to be weak. We expect it to remain weak as the Treasury spends its cash balance to achieve a cash balance of $450 billion by July. This places a significant amount of pressure on the financial system, causing the Federal Reserves Reverse Repo facility to balloon and coincidently causing Total Repo activity to weaken. We don’t think this problem is permanent, especially with the increasing probability of a slowdown in liquidity injection by the Federal Reserve as part of a taper program. Nonetheless, we are watching this closely.
Inflation to Peak Next Month
Below, we show our systematic forecasts of CPI and its subcomponents. We include both a top-down estimate and a bottom-up estimate- obtained via forecasting each subcomponent. We show our CPI monitor below:
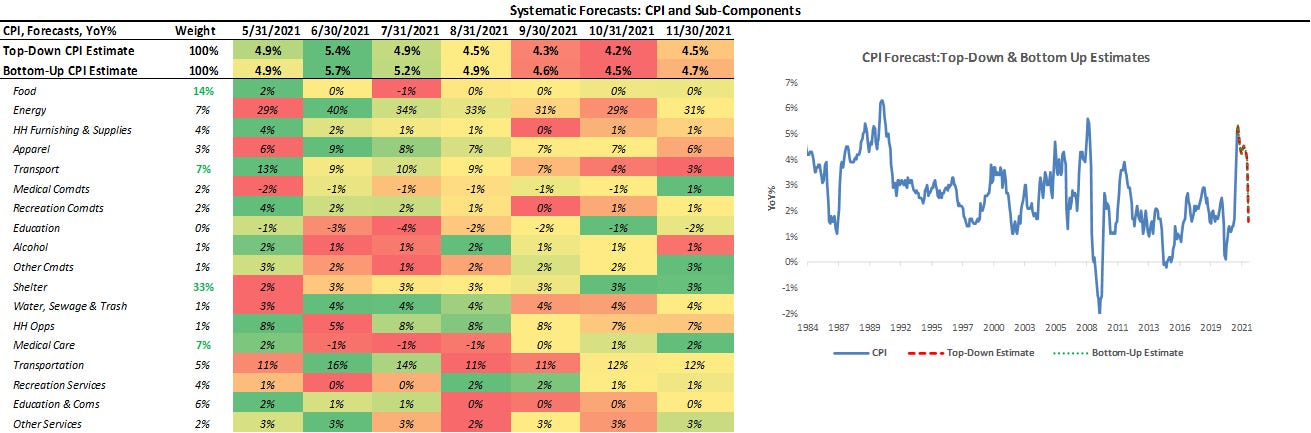
As we can see above, both our top-down and bottom-up estimates concur about the future inflation trend- expecting a peak this month. Our discretionary analysis tells us that there is a chance that inflation could overshoot our systematic estimates. Our systematic forecasts are obtained using measures of trend and cyclicality to near-cast inflation. In the event inflation proves to be sticky, this could overshoot our measures of trend. Therefore, we are carefully monitoring the pervasiveness and persistence of inflation to understand the stickiness of current inflation and will keep you informed as the outlook evolves.
Markets Are Pricing Increasing Likelihood of (-) G (-) I
Using the performance of various asset classes, we can extract what markets are implying which particular economic regime we are in. Below, we show what markets are telling us about the current growth and inflation regime:
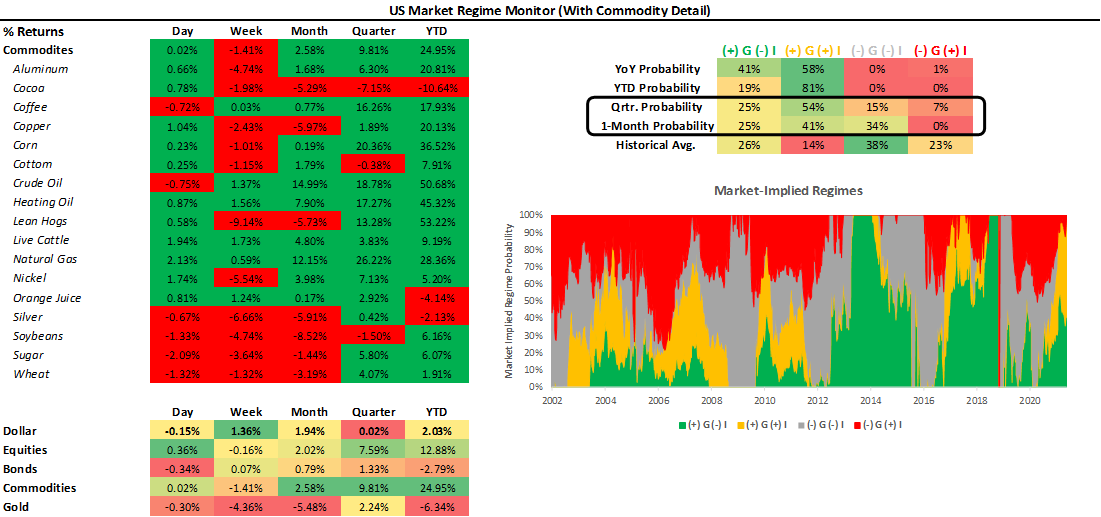
As we have mentioned before, we can be in one of four regimes:
(+) G (-) I: Rising Growth, Falling Inflation
(+) G (+) I: Rising Growth, Rising Inflation
(-) G (+) I: Falling Growth, Rising Inflation
(-) G (-) I: Falling Growth, Falling Inflation
Using our understanding of asset markets, we can classify periods of time into one of the four regimes mentioned above. Markets continue to price a (+) G (+) I environment. However, markets have begun to price (-) G (-) I on a quarter-to-date and a month-to-date basis. A significant portion of this came on the back of the Federal Reserves’ surprisingly hawkish FOMC meeting, which led to significant losses in both equities and commodities. Nonetheless, markets continue to imply that we are still in arising growth and inflation environment, which is consistent with our systematic forecasts for growth and inflation or a rolling quarterly basis. We need to see multi-durational conformation in our market-implied odds to see any decisive change in markets.
(-) G (-) I (-) L = Equities
To understand the prospective path for markets, we triangulate their path by combining our systematic near-casting with our historical regime analysis. Combining these two approaches allows us to understand which assets have the most potential to rise or fall based on cyclicality and economic regime preference. Our asset class preferences are those supported both by the systematic forecast and our expected economic regime. We show this below:
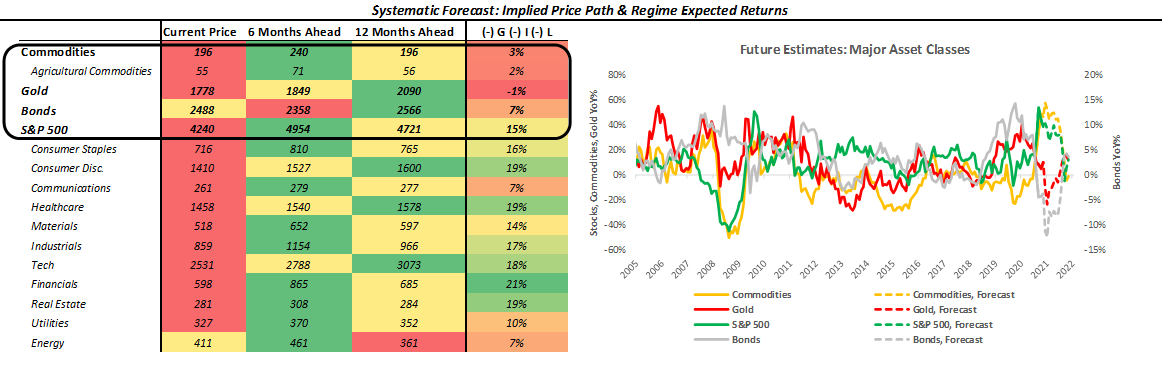
Above, we show the implied price path of various assets, which are obtained quantitatively. Then, we overlay the historical returns during the next expected economic regime defined in terms of growth, inflation, and liquidity. We combine our systematic forecasts for the economy and markets, our discretionary outlook for liquidity, and historical regime analysis to understand the prospective path of major asset classes. Based on this triangulation, we programmatically estimate that the best asset class for a (-) G (-) I (-) L environment starting September will be equities, and the worst asset class will be gold. Our programmatic selection would suggest financials, tech, consumer discretionary, industrials, and healthcare look attractive within the equity space. Now, while our expectation is for (-) G (-) I (-) L, we think it prudent to offer you the entire range of historical regime performance for you to make the best decisions:
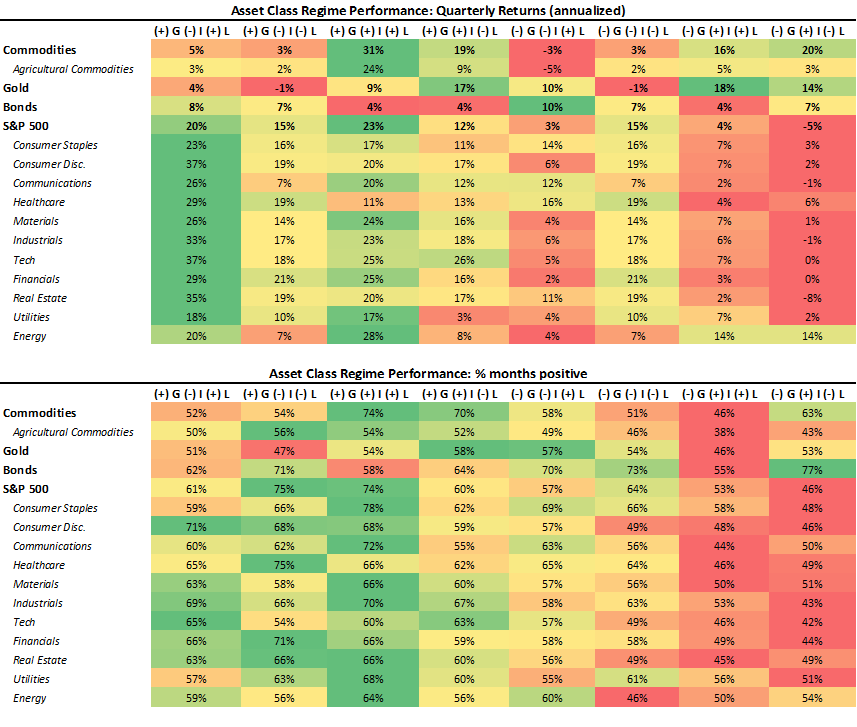
There are two things to keep in mind with our forecasts. There are two things to keep in mind with this forecast. The first is that our systems are dynamic and get more accurate as we get closer to the forecast period. The second is that we use historical data to understand regime biases, which may not always be consistent with the evolution of a sector or asset class. Nonetheless, these estimates should provide a decent roadmap for the potential path of asset markets.
Conclusions
To reiterate:
Current economic data points to robust growth but a sequential slowdown in year-over-year growth rates.
While the liquidity outlook has changed, liquidity remains accommodative.
Our systematic forecast points to inflation peaking this month.
Markets are starting to price (-) G (-) I, i.e., slowing growth and inflation.
We programmatically estimate that the best asset class for a (-) G (-) I (-) L environment will be equities, and the worst asset class will be gold.
Markets are still pricing rising growth and inflation. Our estimates point to growth having peaked in April and inflation peaking this month. We expect both to remain at high levels but not accelerate further. Liquidity remains accommodative, but the Fed has pointed to the potential for slowing liquidity soon. The result is a situation with elevated but stable growth and inflation, with the prospect of reduced liquidity. Our systems suggest such a time would be good for equities and bad for gold.