

Economic & Market Views

Today, we offer updates on our economic and financial near-casts, along with our market regime views. As always, we focus on what the economic data tell us about the economy's current state, what markets tell us about expectations, and our systematic near-casting framework telling us about the near-term. Additionally, we show our Market Regime Portfolio, which applies our understanding of market-implied regimes and portfolio construction to give us a sense of the best exposures in the immediate term. Our observations are as follows:
Economic growth rates continue to trend lower. As our systematic forecasts presciently told us since March, economic growth continues to slow down. Our systematic near-casting framework expects economic growth rates to continue to trend lower until the end of the year.
Inflation pressures are cooling. Our Inflation Index points to a moderating inflation impulse, congruent with our systematic forecasts for cooling CPI inflation rates forecasts. Additionally, we dissect the current strength in CPI to show how much of today’s inflation is anomalous relative to history and find only two items particularly anomalous.
Liquidity conditions continue to deteriorate. Our Liquidity Monitor shows broad liquidity declining significantly on a year-over-year basis. In July, private liquidity ranging from checking accounts to repo activity declined, indicating the procyclical liquidity is slowing. We expect this to continue as the impulse from joint monetary-fiscal programs fades.
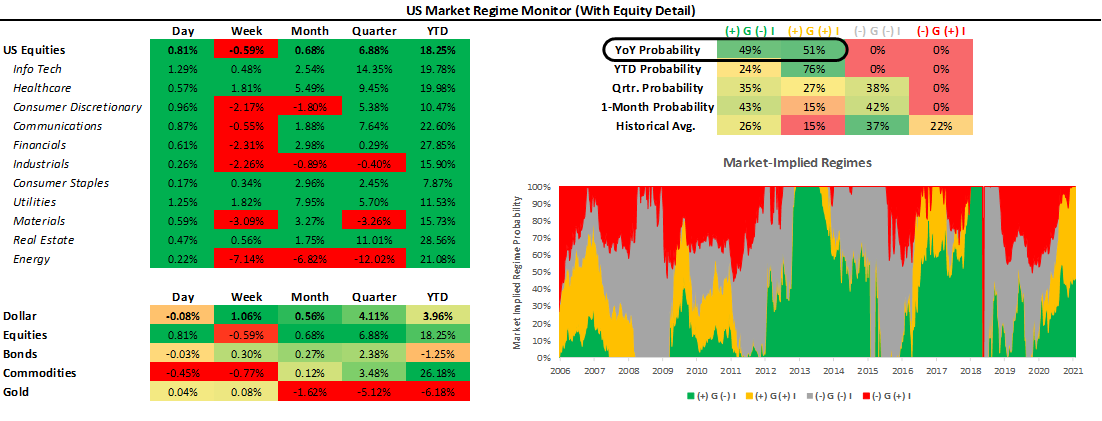
Markets are almost evenly pricing (+) G (+) I and (+) G (-) I, and we think (+) G (-) I is next. Over the last month, markets have largely moved to price in falling inflation. As a result, our Market Regime Monitor has (+) G (+) I and (+) G (-) I now almost equally priced. This has indeed been in line with our systematic forecasts, pointing to an eventual handoff from commodities to equities.
On the current path, H1 2022 could prove to be problematic for risk assets. Our systematic near-casting framework points to growth slowing considerably in Q2 of 2022, coincident with a likely tightening of monetary policy- the combination of which could be a difficult environment for risk assets, and we would expect bonds to be the best performing asset.
The future is dynamic, and our systems adjust as new information is available. Our bias is to allocate for the existing regime while trying to peek around the corner as to what the future may hold. Our Market Regime Portfolio aims to capture the current macroeconomic trend, and our systematic forecasts serve as our way of estimating what the next trend is likely to be. As we said in our last note:
“The current market trend remains (+) G (+) I, but our systems estimate a handoff to (+) G (-) I over the next few months. This is coincident with an economy that will experience slowing but elevated economic growth and inflation, with the prospect of policy liquidity withdrawal. Our programmatic estimates, along with our discretionary analysis of analogous periods in history (2013 taper), tell us that equities will likely be the best performing asset class. Therefore, while our Market Regime Portfolio still prefers commodities exposure, our systems imply that commodities will soon hand off-market leadership to equities in Q4.”
With recent shifts in markets, we are extremely close to the aforementioned hand-off from commodities to equities. For now, our Market Regime Portfolio continues to prefer commodity exposure. Since our last note, it continues to post positive performance, but our systems point to a shift in exposure preference soon. We remain in a rising growth environment (albeit not an accelerating one), which should preferentially support (+) G (pro-growth) assets. Peering into 2022, however, we expect the environment to turn less favorable. We discuss all this and more in the pages that follow.
Economic Growth: Further Slowing
Our Growth Index is our high-frequency measure of the growth impulse to GDP from a wide range of comprehensive economic data. The Growth Index has four subcomponents: risk premia, spending, production, and labor markets. The index measures economic activity at a higher frequency (monthly) and lower latency than quarterly GDP. Current economic data, which feeds the Growth Index, is currently pointing to 4.2% real GDP growth:
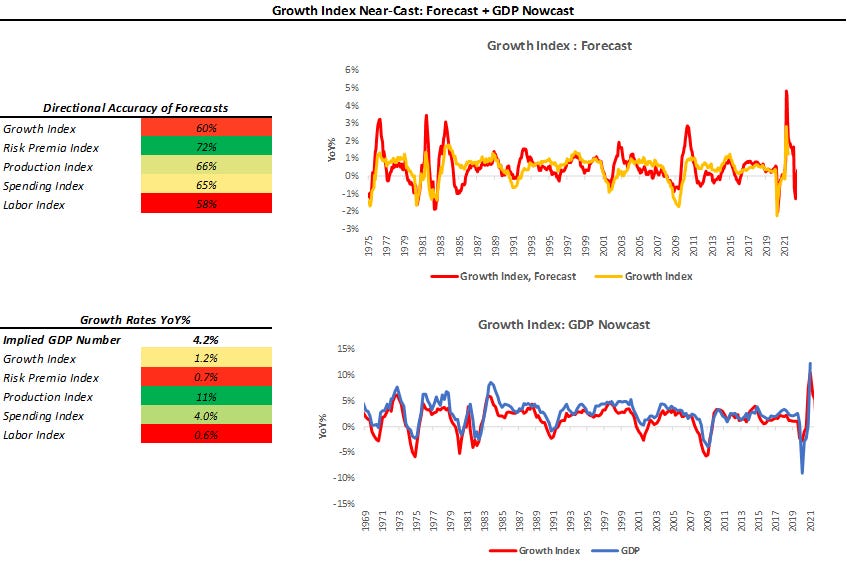
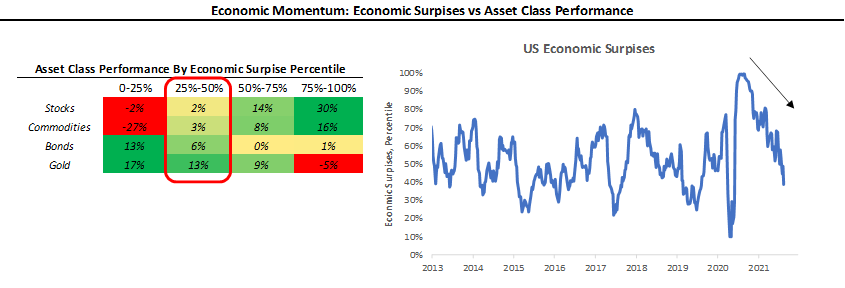
As we can see above, the Growth Index estimates real GDP growth in real-time. The Growth Index has a directional accuracy of 88% in nowcasting real GDP growth. More importantly, unlike many regression-fitted estimates, our Growth Index actually has greater accuracy in nowcasting GDP downturns- our downside directional accuracy is 95%. When we think about our Growth Index, we prefer to focus not on the estimated magnitude of the nowcast but rather the acceleration or deceleration of the nowcast. As we can see above, our Growth Index implies GDP growth of 4.2% on a year-over-year basis, a further slowdown since our last publication where it was at 4.9%. This declining economic momentum has resulted in fewer upside surprises in economic data. Therefore, as we have said before, the underlying trend in growth is still positive, i.e., supportive of cashflows. Still, from a market pricing perspective, the deceleration of economic growth will be less conducive to upside surprises in economic data. We show this below:
Our systematic near-casting framework gave us advance notice of this declining economic momentum, and more importantly, it points to a more significant slowing in H1 of 2022. Our systematic forecasts point to a marked deceleration in our Growth Index, making us increasingly cautious of risk assets in H1 2022. We are a ways off from this point, but, as always, we like to forewarn you well in advance.
Inflation: Cooling, But High
Our Inflation Index is our high-frequency measure of the impulse to inflation from a wide range of comprehensive inflation data. Our Index Index aggregates data across measures of Spending, Expectations, and Commodities to give us an understanding of the degree and pervasiveness of inflation. Further, our Inflation Index allows us to nowcast inflation on an ongoing basis, giving us some insight into upcoming CPI prints:
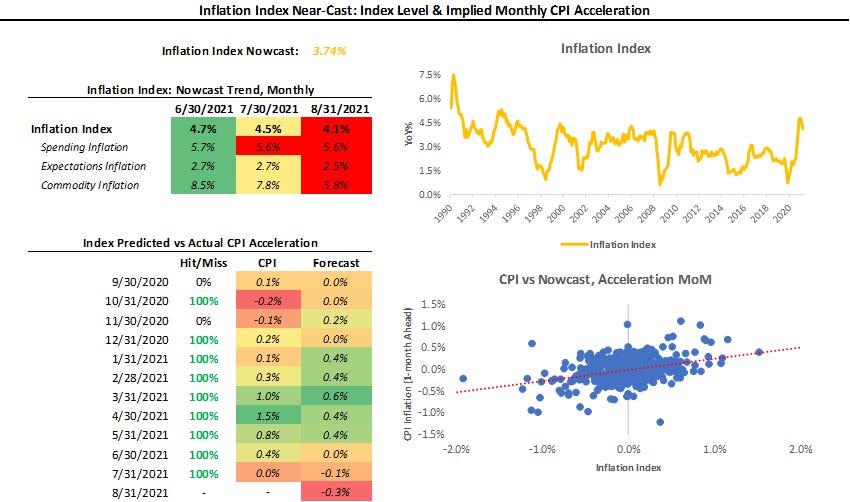
Our Inflation Index has been 58% accurate in determining the acceleration or deceleration of the next print in CPI since 1980. Over the last 12 months, the Inflation Index has had an 83% accuracy in estimating the monthly acceleration in CPI. However, the primary interpretation of our Inflation Index is to understand what the full spectrum of inflation data is telling about current inflationary forces. Before the latest CPI print, our Inflation Index pointed to a cooling in CPI, which materialized in the latest print. This cooling of inflation rates is consistent with what we see in our systematic forecasts for CPI:
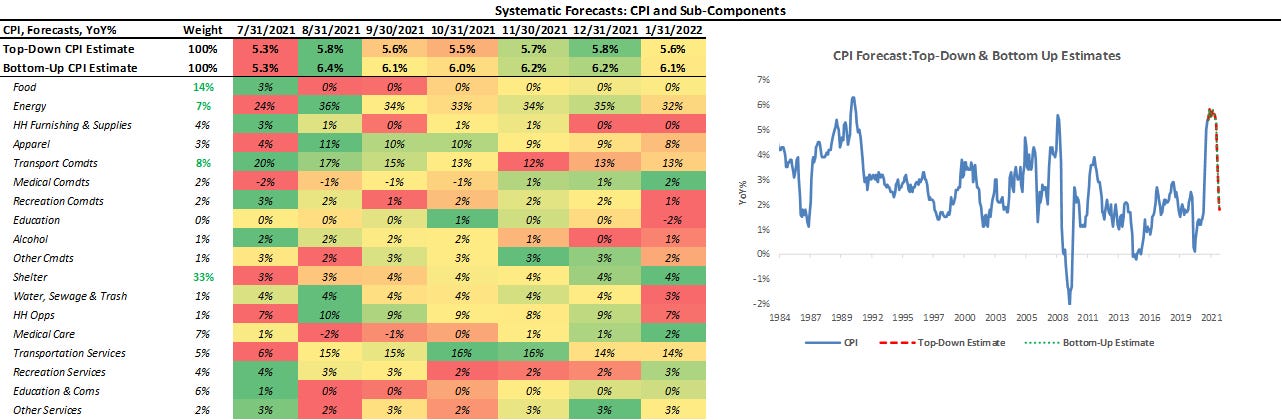
Above, we show our systematic forecasts of CPI and its subcomponents. We include both a top-down estimate and a bottom-up estimate- obtained via forecasting each subcomponent. As we can see above, our top-down and bottom-up estimates concur about the future inflation trend- i.e., that we are at peak inflation levels. Our systematic forecasts use measures of trend and measures of cyclicality to estimate the future trend in inflation. The inflation trend has been strong recently, leading to an elevated forecast level, which we expect to subside in line with our Inflation Index. Nonetheless, there continues to be considerable consternation in markets about the nature, causes, and consequences of elevated inflation prints. To better understand the recent strength in inflation, we decompose CPI into its constituents to understand how much inflation is anomalous. Further, we look at how often we have experienced such a degree of anomalous inflation in recent history. We show this below:
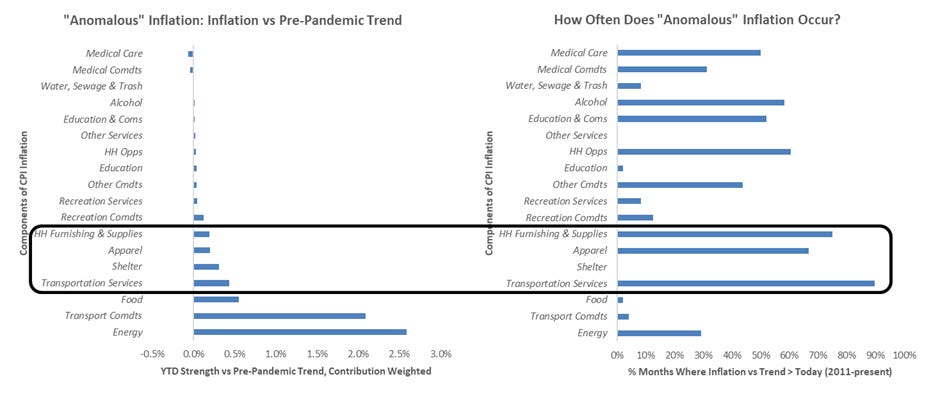
Above, we show two measures. On the left, we show our estimates of current inflation strength relative to its pre-pandemic trend. On the right, we show how often, in the post-2008 era, inflation has been this strong relative to its trend. This analysis leads us to two conclusions. First, there are 5 items where inflation is significantly stronger than pre-pandemic trends: shelter, transportation services, food, transportation commodities, and energy. Second, current trends in inflation aren’t entirely unprecedented, even in the timid post-crisis era: out of our 5 strong items, transportation services have routinely experienced cyclical moves above trend to the current degree. To provide an intuitive visual representation, we combine the above measures to answer the question: how much inflation is anomalous?
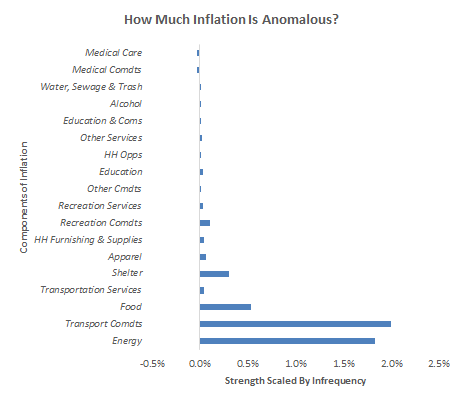
As we can see above, 4 items display anomalous characteristics: transportation commodities, shelter, food & energy. Food and energy are typically considered non-core CPI due to their inherent volatility. Further, these two items have supply chains that the pandemic has immensely impacted, leading us to focus on shelter and transportation commodities. In particular, we think shelter has the potential to be the most persistent driver of inflation over the next few months, as rent moratoriums expire and the gap between home prices and rents close. Overall, our understanding of the inflation landscape leads us to think that the current trend in inflation is likely to cool further, with the notable exception of shelter. As a result, inflation will likely decelerate over the rest of 2021 while staying elevated relative to history. This discretionary view aligns with our systematic forecasts for CPI and the current indications of our Inflation Index; therefore, we are fairly confident in this dynamic playing out as expected.
Liquidity: Private Liquidity to Lead Policy Liquidity Lower?
As part of our analytical framework, we assess the health of the countries’ income statement via growth and inflation and the health of its balance sheet via liquidity. Below, we show our Liquidity Monitor, where we show our broad liquidity measures available to the private sector, along with a heatmap with its major constituents. We also show how the composition of liquidity growth has changed on a rolling quarterly basis:
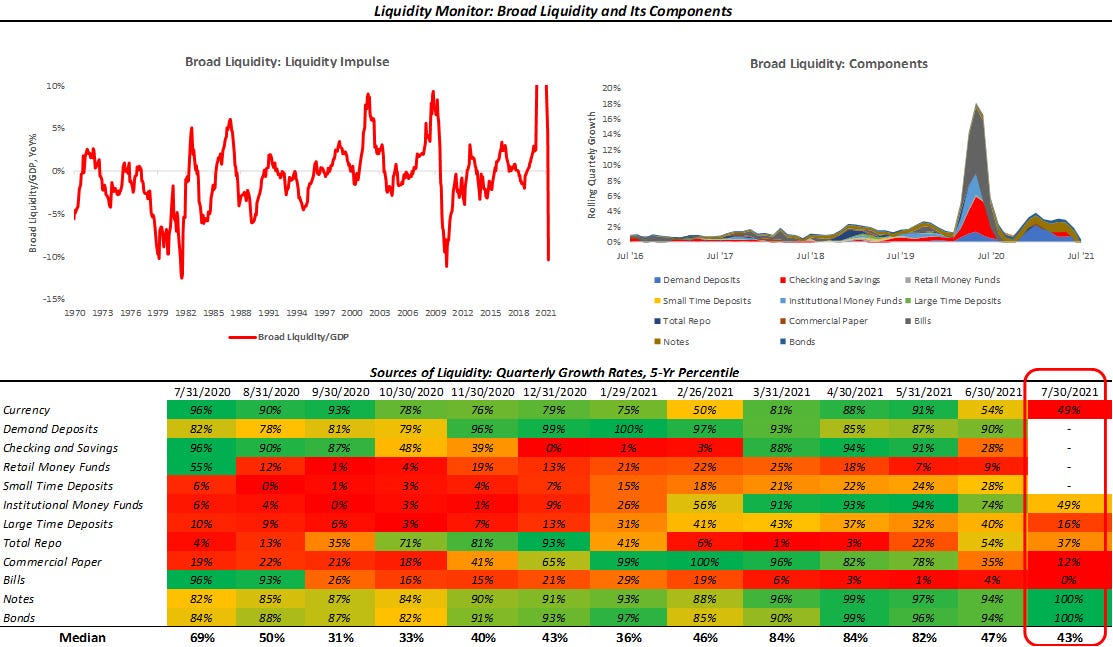
As we can see above, there is now a broad-based decline in private sector liquidity. Particularly, we see areas of concern in the slowdown in total repo activity and the shortage of Treasury bills, both extremely important in the liquidity ecosystem. Further, the drying of fiscal stimulus payments, which are now finding their way into the real economy, dampens the liquidity complex. We think these declining growth rates in the liquidity available to the private sector come at a precarious time. The migration of liquidity to the real economy has brought on a strong economic rebound, leading the Federal Reserve to believe it could withdraw liquidity support from the economy and markets. The reduction of both policy liquidity growth and pro-cyclical liquidity growth in H1 2022 could prove to be a difficult environment to navigate, once again sending us cautionary signals.
For the time being, monetary policy liquidity is still abundant. However, the impulse from fiscal policy measures in the form of large cash balance injections is fading. Further, money market and repo activity have slowed, alongside Treasury bill supply. Overall, the liquidity picture continues to weaken. This bodes ill for aggressive risk-taking and valuation expansion in equities but bodes well for high-quality cash flows and assets with collateral-like qualities.
Market-Implied Regime: (+) G (+/-) I
Using the performance of various asset classes, we can extract what markets are implying which particular economic regime we are in. Below, we show what markets are telling us about the current growth and inflation regime:
As we have mentioned before, we can be in one of four regimes:
(+) G (-) I: Rising Growth, Falling Inflation
(+) G (+) I: Rising Growth, Rising Inflation
(-) G (+) I: Falling Growth, Rising Inflation
(-) G (-) I: Falling Growth, Falling Inflation
Using our understanding of asset markets, we can classify periods of time into one of the four regimes mentioned above. Further, we can use the regime obtained from our market-implied odds with trend-following and cross-sectional momentum measures to create portfolio signals. To provide maximum accessibility, we truncate the portfolio construction into three stages:
Asset Class Selection: We create a portfolio that selects asset class exposure based on the current market-implied regime.
Sector Rotation: We create an equity rotation portfolio that chooses sectors based on their market-regime preference- to avoid overfitting, we choose these logically rather than based on our historical regime performance.
Unlevered Portfolio: We combine Asset Class Selection and Sector Rotation.
Market Regime Portfolio: Finally, we create our Market Regime Portfolio by ex-ante targeting equity volatility, i.e., we use leverage to match equity volatility.
Below, we show the results of this process versus major asset classes. Additionally, we show the performance characteristics over the decades since the 1970s:
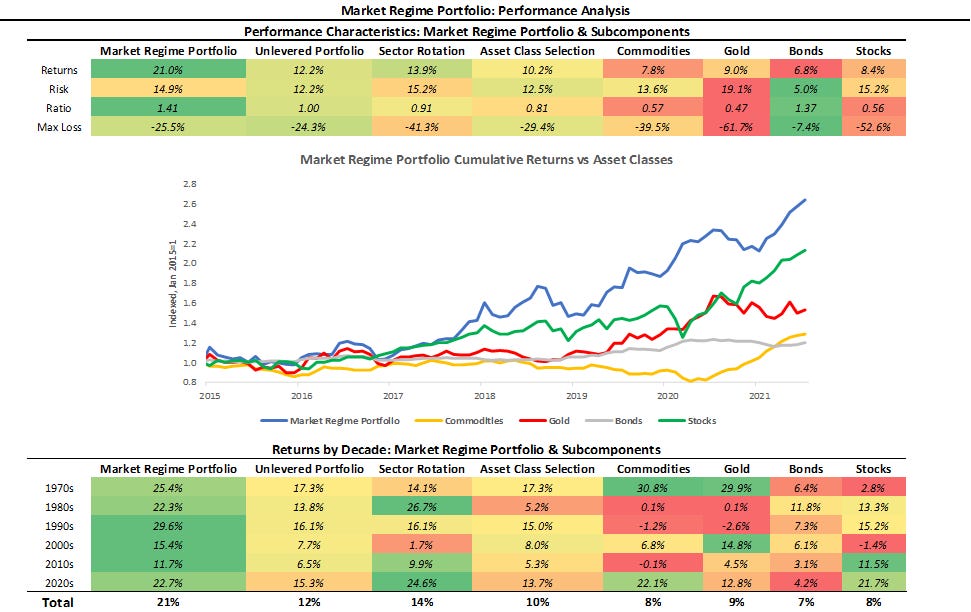
As we can see above, our systematic Market Regime Portfolio has a strong performance across measures and is consistent over time. The portfolio is designed to be decisive and aggressive, wholly allocating to assets that prefer the current regime, with no diversifying exposures. Therefore, we take a significant signal from our market-implied regime signal, which continues to signal we are in a (+) G (+) I environment, almost evenly matched by (+) G (-) I. Over the last month, while the Market Regime Portfolio’s commodity exposures have managed to eke our positive numbers, markets largely favored falling inflation assets preferentially, i.e., stocks and bonds. This move was not unexpected for us. Our systems have pointed to hand-off from (+) G (+) I to (+) G (-) I for a while now, and we continue to expect these moves to materialize:
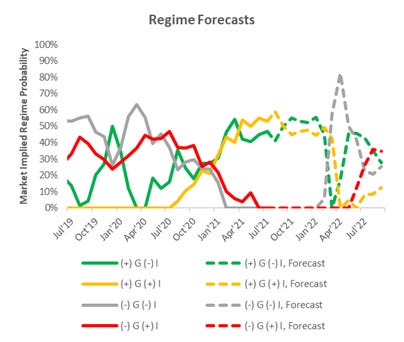
For the time being, rising growth remains the dominant regime. Peering around the corner into 2022, our systems signals are starting to align for (-) G (-) I, i.e., when the economy is likely to slow, and monetary policy could potentially tighten.
Conclusions: Taper Tantrum?
Before delving into our thoughts on the market impact of a taper, lets us reiterate the signals coming from our systems:
Economic growth continues to slow its pace. Our systematic forecasts estimate that economic growth will slow significantly in H1 of 2022.
Inflation is cooling. Our Inflation Index and systematic forecasts point to a cooling of inflation rates, consistent with our discretionary analysis of inflation components.
Liquidity is deteriorating. Pro-cyclical liquidity looks set to lead monetary policy liquidity lower in H1 2022.
Markets are evenly pricing (+) G (-) I & (+) G (+) I, marginally favoring the latter. Our systems point to a hand-off to (+) G (-) I in the next month or so.
Given this macroeconomic backdrop, H1 2022 looks to be the next major shift both for the economy and markets. As we have shown in the past, taper does not necessarily have to be negative for risky assets:
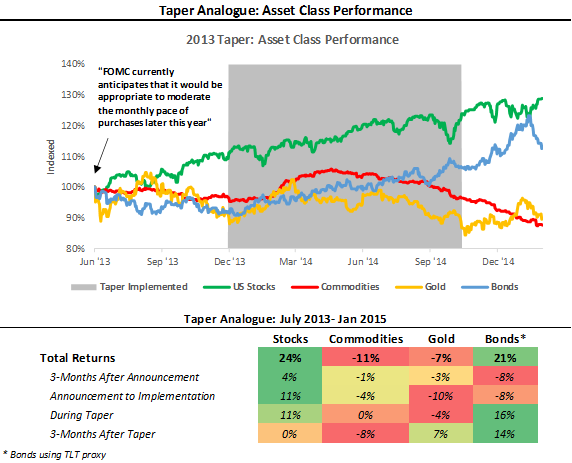
As we can see above, US equities were the strongest performing asset class during the last taper from announcement to implementation. Subsequently, bonds went on to be the best performing asset class during the taper. We wouldn’t be surprised to find a similar dynamic in 2022. As we head into the close of 2021, the US economy will likely remain in strong positive territory, supporting equity prices. However, our programmatic estimates expect growth to fade significantly in H1 2022, coincident with the likely implementation of taper. This environment could prove potentially difficult for equities and commodities, leading to a (-) G (-) I environment. Indeed these moves are far in the forecasting future, but as always, we think it is important to prepare for regime shifts well in advance. For the time being, our systems continue to favor growth exposures, and our Market Regime Portfolio remains aligned with this. We will keep you abreast of how this changes. Until next time.
another thoughtful note, thanks. question...on you sector rotation portfolio. you say you choose logically rather than based on historical regime performance. but safe to assume you use historical regime performance to inform the decision? what is an example of a logical choice that isn't consistent with regime performance? also, what is the current sector rotation model positioning?