

Economic & Market Views

Today, we offer updates on our economic and financial near-casts, along with our market regime views. As always, we focus on what the economic data tell us about the economy's current state, what markets tell us about expectations, and our systematic near-casting framework telling us about the near-term. Additionally, we show our Market Regime Portfolio, which applies our understanding of market-implied regimes and portfolio construction to give us a sense of the best exposures in the immediate term. Our observations are as follows:
Economic growth rates continue to trend lower. Our GDP nowcast pointed to a lower level of growth after the economic data prints in July. Our systematic forecasts expect a continuation of this trend for the rest of the year.
Inflation is at a critical juncture. Our Inflation Index tells us that broad measures of inflation are trending lower, though modestly. Our systematic inflation forecasts point to stabilizing inflation as well.
Liquidity conditions are deteriorating as the impulse from joint monetary-fiscal programs is fading. Despite the Fed re-upping its liquidity injections via monetary policy, broad liquidity conditions continue to slow on the back of last year’s joint monetary & fiscal impulse fading. While this isn’t the end of the world, the drying up of this liquidity is marginally less supportive of risk assets.
Markets continue to price (+) G (+) I. Despite a shaky start to the month, rising growth and inflation remained the preferred exposure of our Market Regime Portfolio, thereby leading to strong portfolio performance in July. Nonetheless, our systematic market regime forecasts expect a transition in the next few months, and our systems expect a shift to (+) G (-) I, which we continue to watch carefully.
Thoughts on persistent inflation and market regimes. While we have indeed reiterated that our expectations have been for (-) G (-) I (-) L in the back half of this year, we think it is worthwhile to consider the implications of persistent inflation. Using our historical regime analysis in conjunction with our cyclicality forecasts, we show how the current trend in commodities strength could continue if inflation rates show trend persistence.
The future is dynamic, and our systems adjust as new information is available. Our bias is to allocate for the existing regime while trying to peek around the corner as to what the future may hold. Our Market Regime Portfolio aims to capture the current macroeconomic trend, and our systematic forecasts serve as our way of estimating what the next trend is likely to be.
The current market trend remains (+) G (+) I, but our systems estimate a handoff to (+) G (-) I over the next few months. This is coincident with an economy that will experience slowing but elevated economic growth and inflation, with the prospect of policy liquidity withdrawal. Our programmatic estimates, along with our discretionary analysis of analogous periods in history (2013 taper), tell us that equities will likely be the best performing asset class. Therefore, while our Market Regime Portfolio still prefers commodities exposure, our systems imply that commodities will soon hand off-market leadership to equities in Q4.
If inflation proves to be persistent, the alternative would be a continuation of the current (+) G (+) I market regime trend. For now, our systematic forecasts and Inflation Index don’t expect this outcome, but it is well within the realm of possibilities.
We discuss all this and more below.
Economic Growth: Trending Lower
Our Growth Index is our high-frequency measure of the growth impulse to GDP from a wide range of comprehensive economic data. The Growth Index has four subcomponents: risk premia, spending, production, and labor markets. The index measures economic activity at a higher frequency (monthly) and lower latency than quarterly GDP. Current economic data, which feeds the Growth Index, is currently pointing to 4.9% real GDP growth:
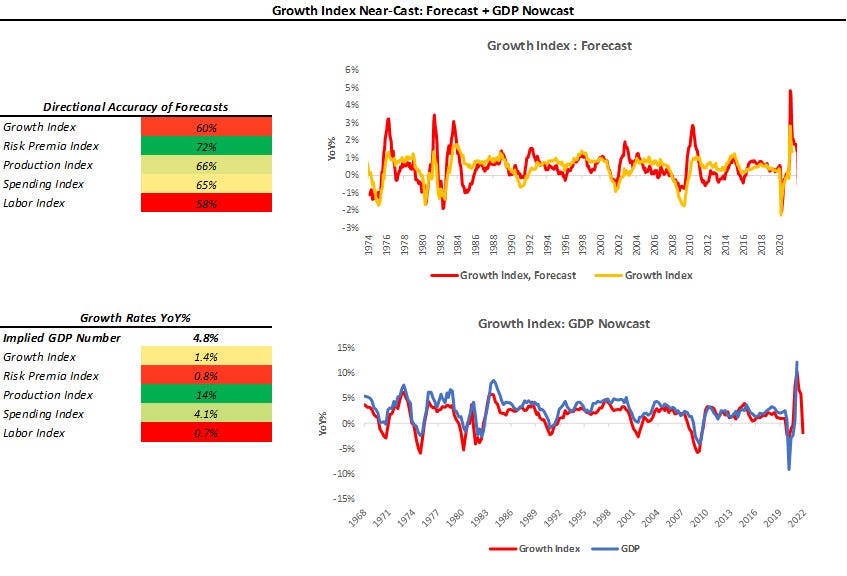
As we can see above, the Growth Index estimates real GDP growth in real-time. The Growth Index has a directional accuracy of 88% in nowcasting real GDP growth. More importantly, unlike many regression-fitted estimates, our Growth Index actually has greater accuracy in nowcasting GDP downturns- our downside directional accuracy is 95%. When we think about our Growth Index, we prefer to focus not on the estimated magnitude of the nowcast but rather the acceleration or deceleration of the nowcast. As we can see above, our Growth Index implies GDP growth of 4.9% on a year-over-year basis, a further slowdown since our last publication where it was at 5.7%. Our Nowcast did a good job estimating the trend in sequential strength in the latest GDP numbers. Our systems had the print at 10%, with the actual print coming in at 12%. The recent decelerating GDP growth rates have been broad-based across our Spending, Risk Premia, Production, & Labor Indexes. To get a better sense of some of the activity underlying this data, below we show some of the changes in income and spending:
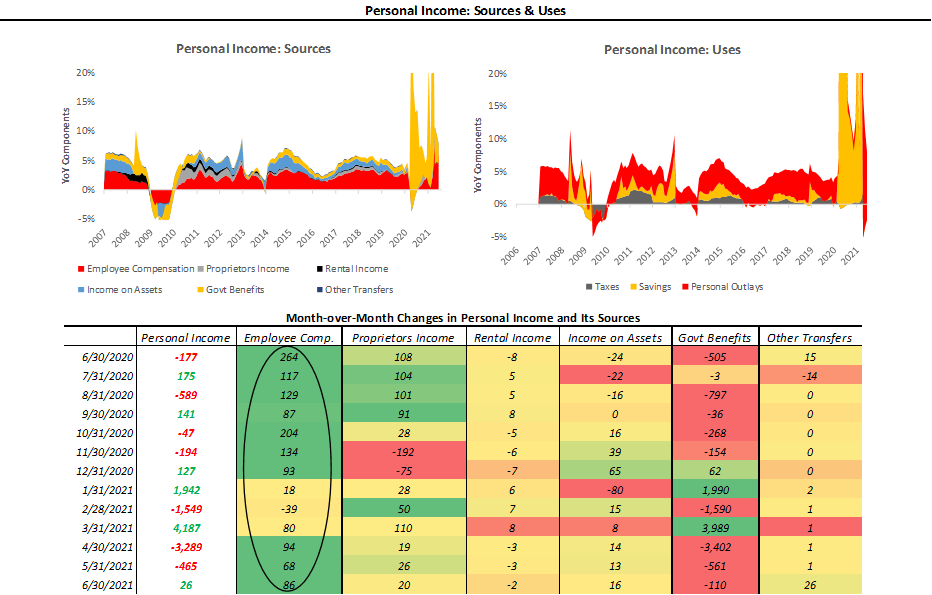
As we can see above, incomes came in sequentially stronger due to increases in employee compensation. The majority of this income increase was coincident with a drawdown in savings, shown below:
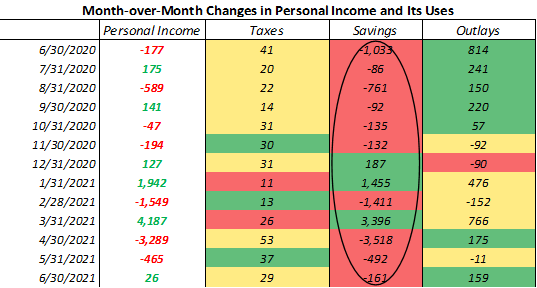
These savings have found their way into spending recently, predominantly in the form of spending on food and accommodations:
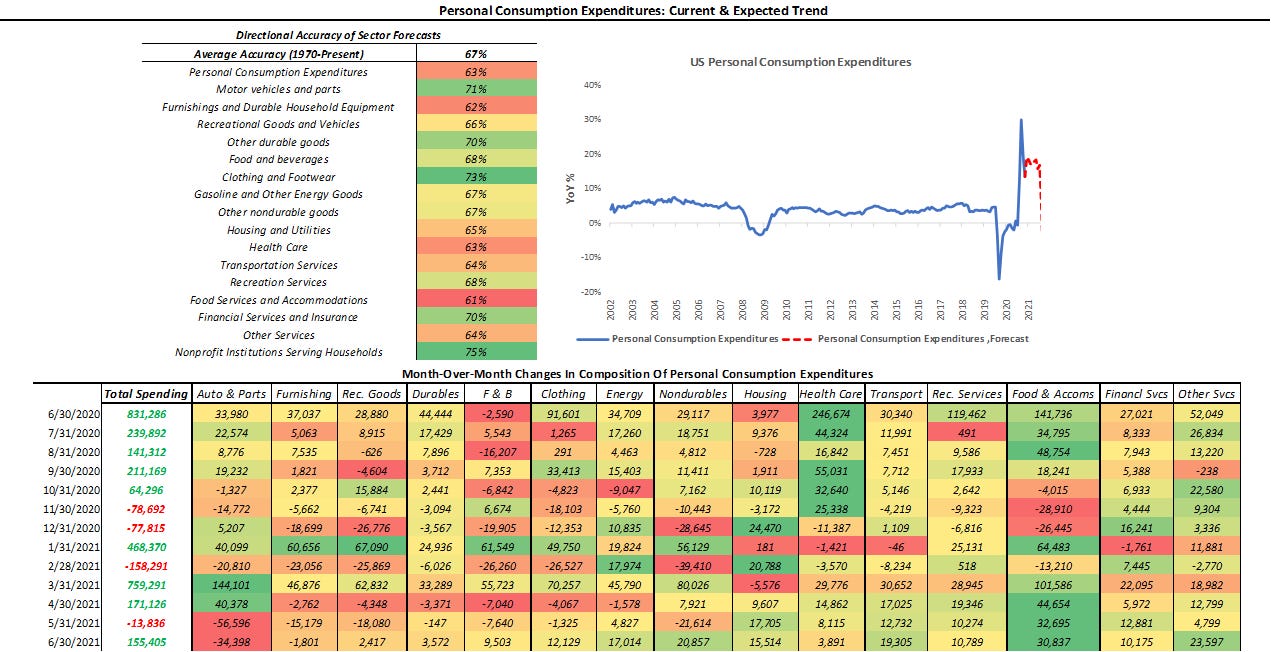
Given the strength of spending concentrated in areas of the economy that were curtailed by the pandemic, we think of the current trend as one driven by the theme of economic re-opening. Overall, the monthly trend in data is still positive. Still, the rate of acceleration in these positive developments has been slowing for a while now, which has been continuously expressed by our Growth Index. Our systematic near casting framework points to GDP growth remaining elevated for the rest of the year. This bodes well for risk assets from a real-economic standpoint, as cashflows are likely to remain rising. However, from a market pricing perspective, this would not be as supportive as the current environment as the potential for downside surprises for data will increase as growth rates decelerate.
Inflation: At Peak Levels
Our Inflation Index is our high-frequency measure of the impulse to inflation from a wide range of comprehensive inflation data. Our Index Index aggregates data across measures of Spending, Expectations, and Commodities to give us an understanding of the degree and pervasiveness of inflation. Further, our Inflation Index allows us to nowcast inflation on an ongoing basis, giving us some insight into upcoming CPI prints:
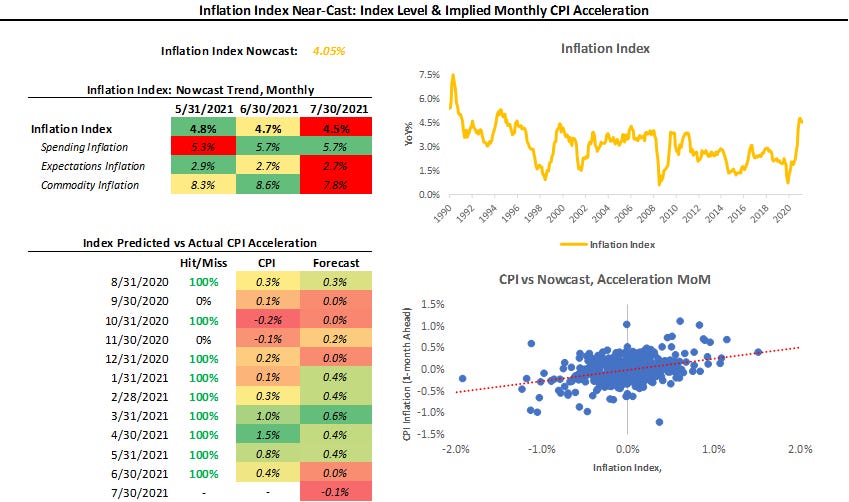
Our Inflation Index has been 58% accurate in determining the acceleration or deceleration of the next print in CPI since 1980. Over the last 12 months, the Inflation Index has had an 83% accuracy in estimating the monthly acceleration in CPI. However, the primary interpretation of our Inflation Index is to understand what the full spectrum of inflation data is telling about current inflationary forces. Currently, our Commodities Inflation and Expectations measures have started to cool, while Spending Inflation runs particularly hot. It remains to be seen whether measures of spending inflation will converge to commodities and expectations, or vice versa. Our systematic bias is for spending inflation to cool. To get a sense of the moves to come, we look at our systematic forecasts for CPI:
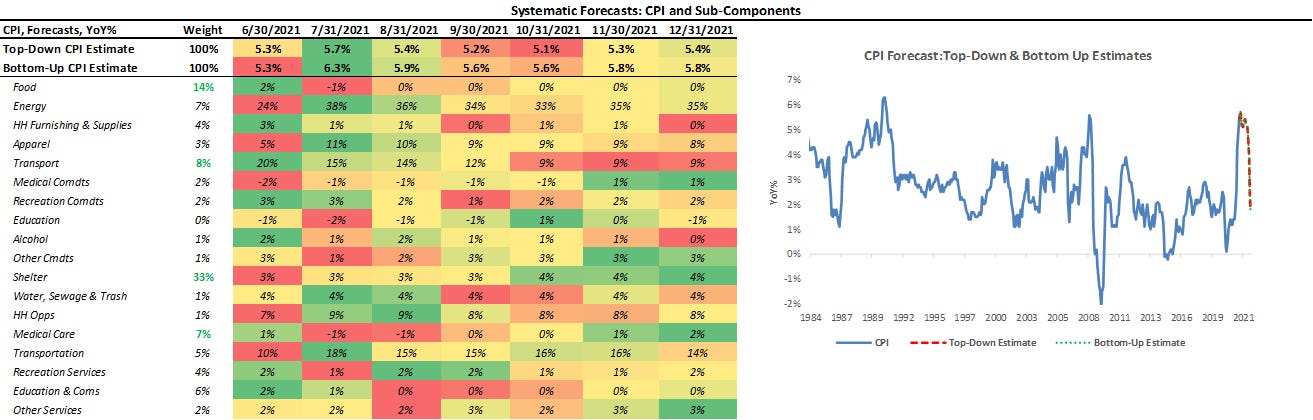
Above, we show our systematic forecasts of CPI and its subcomponents. We include both a top-down estimate and a bottom-up estimate- obtained via forecasting each subcomponent. As we can see above, our top-down and bottom-up estimates concur about the future inflation trend- expecting a peak this month. As we can see, the systematic forecast is extremely elevated throughout the year. This is because our systematic forecasts are obtained using measures of trend and cyclicality, and recent prints have imposed a strong trend on the underlying data. Therefore, we are waiting and watching for the next print very carefully. If the inflation trend is indeed confirmed to be a “new normal,” we could have significantly higher inflation through the year. Our bias remains that inflation rates remain elevated, but the acceleration will subside. Nonetheless, we will carefully monitor changes in our Inflation Index to assess changes in the inflation trend.
Liquidity: Last Year’s Impulse Is Fading
As part of our analytical framework, we assess the health of the countries’ income statement via growth and inflation and the health of its balance sheet via liquidity. Below, we show our Liquidity Monitor, where we show our broad liquidity measures available to the private sector, along with a heatmap with its major constituents. We also show how the composition of liquidity growth has changed on a rolling quarterly basis:
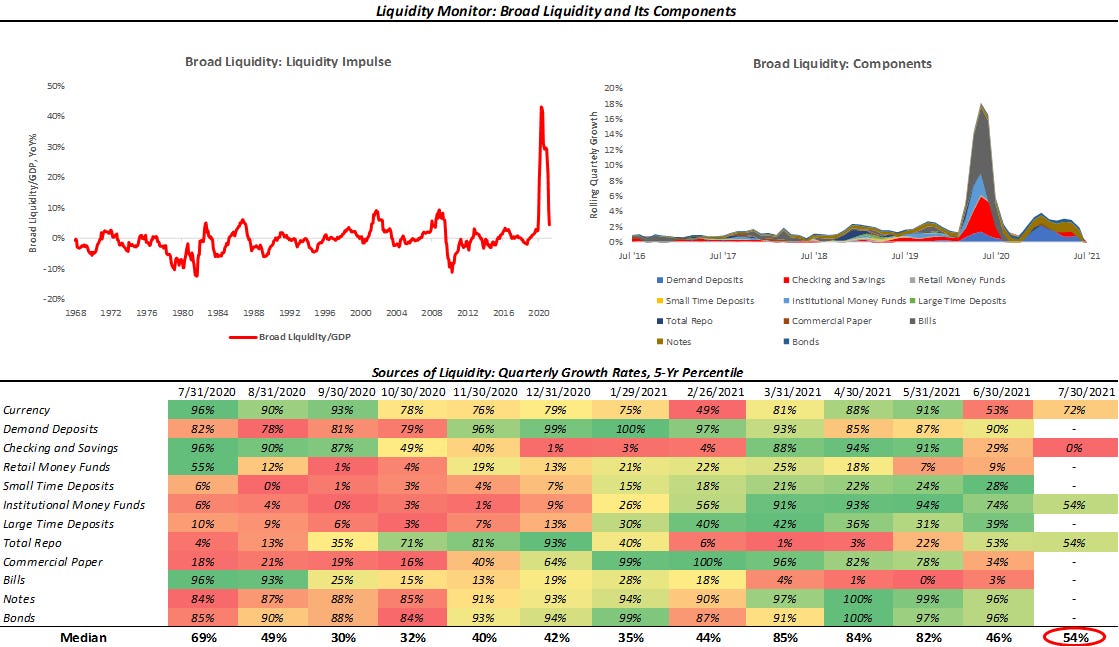
As we can see above, liquidity growth has indeed begun to decline. Predominately, we are seeing two types of liquidity shortages in the private sector. The first is the liquidity shortage in US treasuries, an essential liquidity source for the financial sector. This shortage has caused a swelling in the usage of the Fed’s reverse repo facility, which constitutes a liquidity drain. The second emerging liquidity slowdown is coming from fiscal transfer payments drying up, which made their way into checking and savings accounts. This is coincident with the re-opening of the economy, i.e., these cash balances are likely finding their way into real spending. Therefore, the impulse from joint monetary-fiscal injections is starting to fade, and the gap created might be too big for the private sector to fill by itself. This is coincident with a potential tapering of the Fed’s balance sheet. Therefore, the liquidity outlook is one of weakening liquidity growth. However, as we explained in our last note, this doesn’t necessarily mean the end of the world for risk- assets:
“Risk assets were particularly resilient during the last taper. Furthermore, equities actually posted the strongest returns of major asset classes. We attribute this to the stable growth and inflation environment achieved during this period. We expect a similar environment going into the end of this year, slowing but stable (and high) growth & inflation, with tightening policy liquidity. Therefore, it is entirely plausible that equities could once again be the best performing asset class during a tightening of policy liquidity. Now, while this analog does create a roadmap of sorts for expected asset class performance, the market regime will determine the realized performance of asset classes.”
Market-Implied Regime: (+) G (+) I
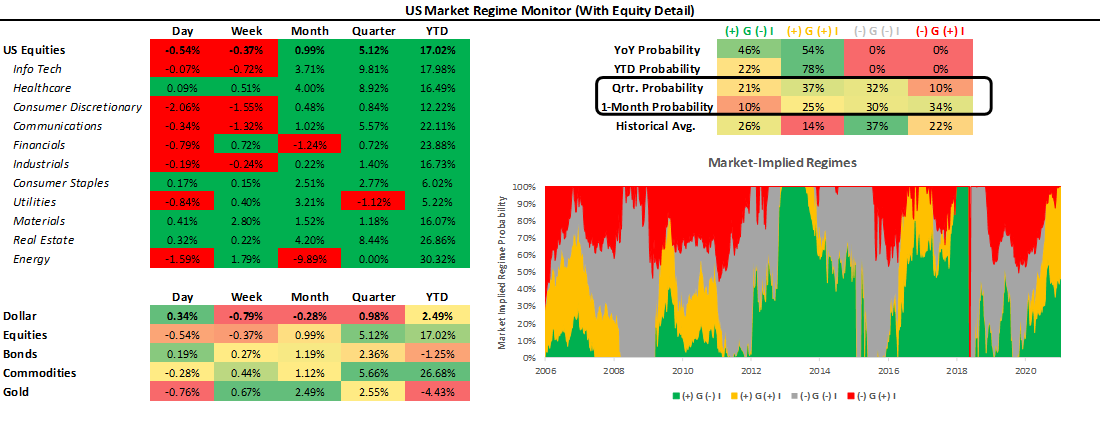
Using the performance of various asset classes, we can extract what markets are implying which particular economic regime we are in. Below, we show what markets are telling us about the current growth and inflation regime:
As we have mentioned before, we can be in one of four regimes:
(+) G (-) I: Rising Growth, Falling Inflation
(+) G (+) I: Rising Growth, Rising Inflation
(-) G (+) I: Falling Growth, Rising Inflation
(-) G (-) I: Falling Growth, Falling Inflation
Using our understanding of asset markets, we can classify periods of time into one of the four regimes mentioned above. Further, we can use the regime obtained from our market-implied odds in conjunction with trend-following and cross-sectional momentum measures to create portfolio signals. To provide maximum accessibility, we truncate the portfolio construction into three stages:
Asset Class Selection: We create a portfolio that selects asset class exposure based on the current market-implied regime.
Sector Rotation: We create an equity rotation portfolio that chooses sectors based on their market-regime preference- to avoid overfitting, we choose these logically rather than based on our historical regime performance.
Unlevered Portfolio: We combine Asset Class Selection and Sector Rotation.
Market Regime Portfolio: Finally, we create our Market Regime Portfolio by ex-ante targeting equity volatility, i.e., we use leverage to match equity volatility.
Below, we show the results of this process versus major asset classes. Additionally, we show the performance characteristics over the decades since the 1970s:

As we can see above, our systematic Market Regime Portfolio has a strong performance across measures and is consistent over time. The portfolio is designed to be decisive and aggressive, wholly allocating to assets that prefer the current regime, with no diversifying exposures. Therefore, we take a significant signal from our market-implied regime signal, which continues to imply with are in a (+) G (+) I regime. After a shaky start to July, markets rewarded (+) G (+) I exposures. As a result, our Market Regime Portfolio had a strong performance over July due to its aggressive 100% allocation to commodities.
Looking ahead, our systematic forecasts point to an eventual hand-off in the market-implied regime from (+) G (+) I to (+) G (-) I. Further, the odds of (+) G (-) I remain elevated as well at this time so that it won’t take too much to tip the scales in favor of these exposures, i.e., equities (tech, consumer discretionary, and real estate). Nonetheless, current market implied regime odds continue to point to (+) G (+) I, and we will keep you abreast of and when that changes.
What If Inflation Is Persistent?
While we have defined the current regime using our market-implied regime odds, we also try to peer around the corner to see what the future may hold. To do so, we combine our systematic forecasts for the economy and markets, our discretionary outlook for liquidity, and historical regime analysis to understand the prospective path of major asset classes. Based on this triangulation, we think the next environment will likely be (-) G (-) I (-) L, i.e., falling growth, inflation, and liquidity, and in past editions, we have shown how equities would be the best performing asset.
However, in today's environment, there is also the potential that inflation proves to be persistent and for markets to move accordingly. This would be a (-) G (+) I (-) L environment, and we think it makes sense to look at how markets have typically performed in this environment in conjunction with our cyclical forecasts:
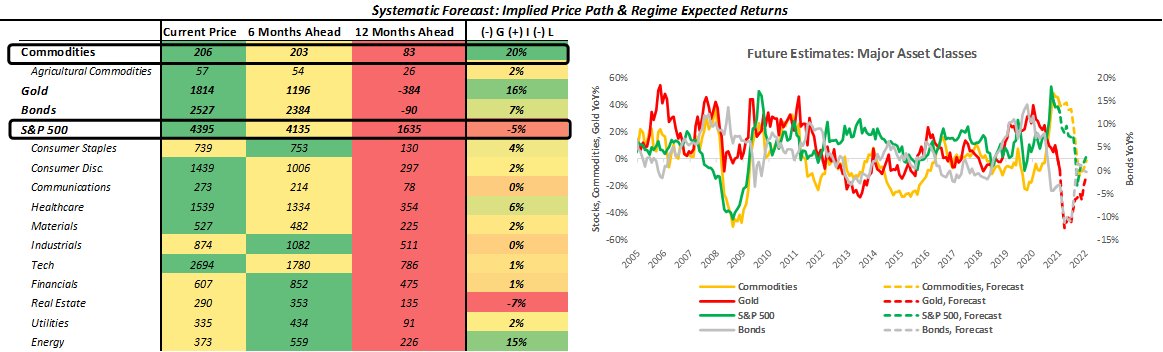
As we can see above, a stagflationary environment would be quite different from the expected outcome, with equities performing extremely poorly. However, while this would be a different path from our expected regime change, it would be a continuation of the current market trend, i.e., commodity outperformance. Currently, our Market Regime favors commodity exposure, and if inflation proves to be persistent, commodities are likely to continue being the best performing asset class. Alternatively, our systematic forecasts for a regime change could prove correct, and we could see a regime leadership hand-off from commodities to equities. All this goes to say, the future is dynamic, and transitioning exposure before a market regime change would not be optimal. However, these triangulated forecasts help us understand what is to come and help us prepare for an eventual transition (or lack of one).
Conclusions
Economic growth rates continue to trend lower. Our systems point to elevated but decelerating economic growth for the rest of the year.
Inflation is at a critical juncture, and the next few prints will decide whether inflation is transitory or persistent (our systems point to peak inflation currently).
Liquidity conditions are deteriorating as the impulse from joint monetary-fiscal programs is fading.
Markets continue to price (+) G (+) I, but we expect a transition to (+) G (-) I later this year.
If inflation proves sticky, markets could continue the current trend of commodity outperformance, i.e., continued (+) G (+) I.
Overall, it looks fairly clear that the growth and inflation outlook is one of post-peak de-cceleration. Inflation is the major item in question in our minds, and we will need to carefully watch our Inflation Index and its subcomponents for trend persistence. Markets are currently pricing in (+) G (+) I, and we expect an eventual hand-off to (+) G (-) I. If inflation proves to be persistent, we could see an extension of the current market regime into the end of the year. Therefore, as we have always said, maintaining exposure consistent with the current regime, and preparing for potential changes is the approach that will likely yield the best results. We will continue to keep you updated as the data and environment evolve. Until next time.