

Economic & Market Views

Today, we offer updates on our economic and financial near-casts, along with our market regime views. As always, we focus on what the economic data tell us about the economy's current state, what markets tell us about expectations, and our systematic near-casting framework telling us about the near-term. Additionally, we show our Market Regime Portfolio, which applies our understanding of market-implied regimes and portfolio construction to give us a sense of the best exposures in the immediate term. Our observations are as follows:
Economic growth is marginally lower. Most recent data has moved our economic nowcast marginally lower. We show the composition of the sources and uses of income, and we continue to see drawdowns in savings finding their way into the real economy. Our systematic near-casting framework expects economic growth rates to continue to decrease until the end of 2021 and show concerning deceleration in H1 2022.
Inflation has stabilized. Our Inflation Index, which measures the broad impulse to inflation, shows that inflationary pressures are more or less unchanged since our last publication. Inflation remains elevated, and our near-casting framework implies a deceleration in CPI in the next print.
Liquidity is increasingly a cause for concern. Our Liquidity Monitor shows cracks emerging in the liquidity ecosystem. Monetary policy remains accommodative, but the Treasury bill supply continues to contract, creating a dearth of pristine collateral. Additionally, private liquidity continues to deteriorate as the market financing weakens, alongside cash balances from fiscal injections. We show how our Policy Impulse Index has deteriorated significantly this year, implying tougher market conditions next year through its leading nature.
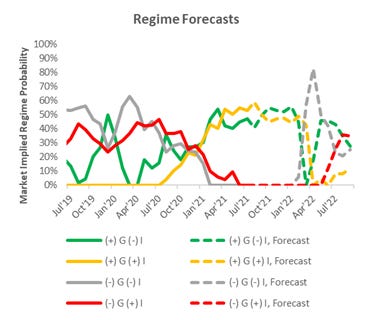
Markets continue to price (+) G. Markets are equally implying odds of (+) G (-) I and (+) G (+) I, with the momentum for the latter waning. Over the last month, markets have dominantly priced (+) G (-) I, and our systems expect this to become the dominant market regime. During this time, our Market Regime Portfolio has been modestly weaker in performance, still waiting on signal confirmation to shift to equities from commodities.
The future is dynamic, and our systems adjust as new information is available. Our bias is to allocate for the existing regime while trying to peek around the corner as to what the future may hold. Our Market Regime Portfolio aims to capture the current macroeconomic trend, and our systematic forecasts serve as our way of estimating what the next trend is likely to be. Our Market Regime Portfolio is currently allocated to commodities, and our systematic forecasts expect a shift to a preference for equities shortly. The portfolio was designed to capture regime persistence. Therefore, the allocation has yet to shift. It is worth considering transitioning exposure to equities before signal confirmation by the Market Regime Portfolio for those more nimble.
Overall, the economic environment remains one of decelerating economic momentum, and our systematic near-casting framework points to a continuation of this trend until the end of 2021. Given recent monetary policy developments, in conjunction with our economic near-casts, we are increasingly concerned about the environment likely to develop on H1 2022- i.e., policy liquidity tightening + significantly slowing economic data. We discuss all this in the pages that follow.
Economic Growth: Marginally Slower
Our Growth Index is our high-frequency measure of the growth impulse to GDP from a wide range of comprehensive economic data. The Growth Index has four subcomponents: risk premia, spending, production, and labor markets. The index measures economic activity at a higher frequency (monthly) and lower latency than quarterly GDP. Current economic data, which feeds the Growth Index, is currently pointing to 4.0% real GDP growth:
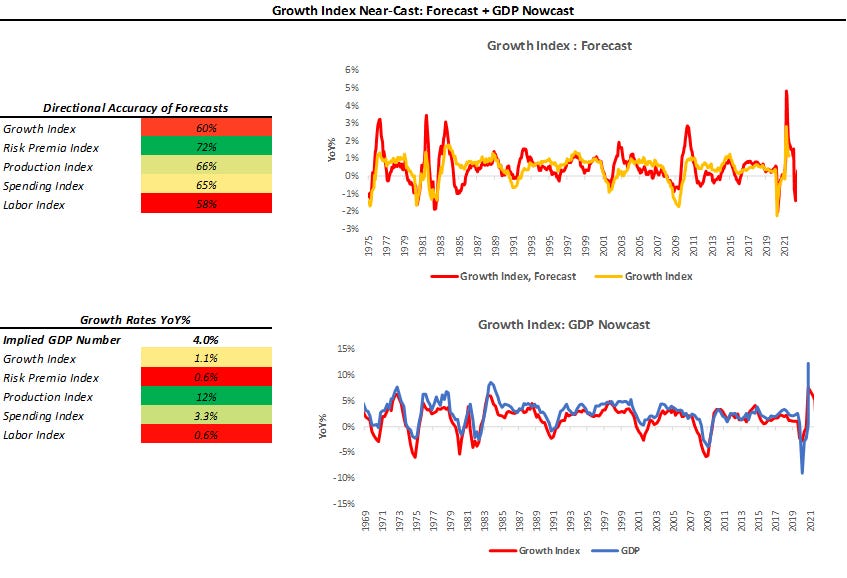
As we can see above, the Growth Index estimates real GDP growth in real-time. The Growth Index has a directional accuracy of 88% in nowcasting real GDP growth. More importantly, unlike many regression-fitted estimates, our Growth Index actually has greater accuracy in nowcasting GDP downturns- our downside directional accuracy is 95%. When we think about our Growth Index, we prefer to focus not on the estimated magnitude of the nowcast but rather the acceleration or deceleration of the nowcast. As we can see above, our Growth Index implies GDP growth of 4.0% on a year-over-year basis, a further slowdown since our last publication where it was at 4.2%. To offer some color on the data underlying these shifts, we show the composition of the sources and uses of income below. We start with the composition of income sources:
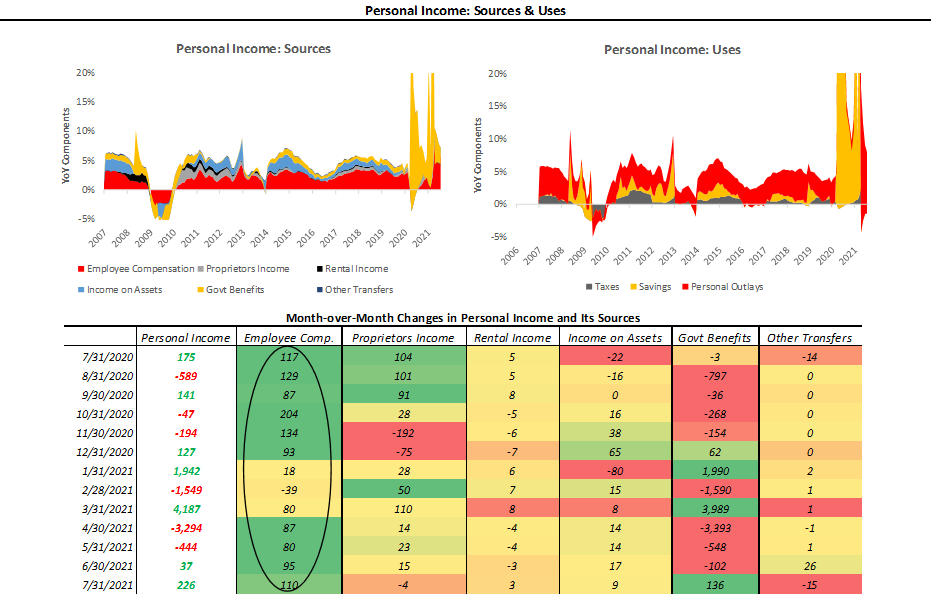
As we can see above, the trend in income has generally been one of moderating growth rates following a massive rise in incomes on the back of government stimulus. The discontinuation of these government transfers has weighed on income growth, but employee compensation has been cushioned the blow. Now, while government stimulus was in full force, these income increases largely found their way into increased savings rates, and as they subsided, so have savings rates:
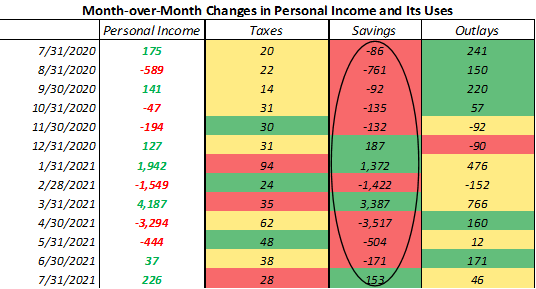
As a larger portion of income is spent, these savings are finding their way into areas of the economy that were depressed by the pandemic, i.e., we see a normalization in spending trends:
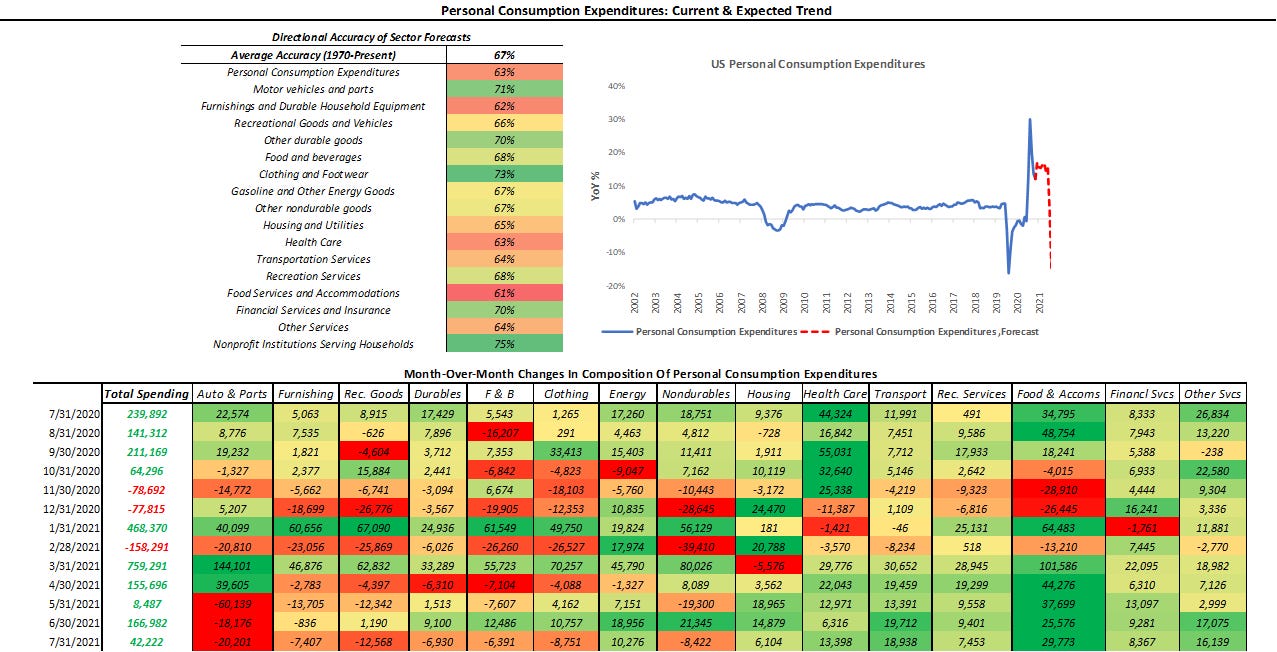
Overall, the growth outlook is still positive for the remaining months in 2021, but with a decelerating trend. Incomes and spending continue to grow, but organic income growth will have difficulty filling the hole created by government stimulus. Therefore, we will likely see a significant slowdown in spending rates towards historical norms, consistent with our systematic forecasts. This declining economic momentum will likely result in fewer upside surprises in economic data. Therefore, risk assets will be supported by positive levels of growth but only modestly supported by surprises in economic data. Below, we show how economic data surprises impact the distribution of returns in asset markets:
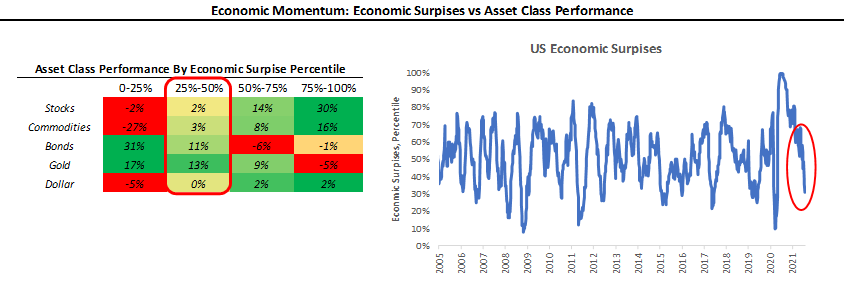
Over the course of 2021, as economic growth rates have faded, economic data surprises have trended lower, per our expectations. We are currently at 31%- now flirting with the lowest percentile of economic surprises (0-25%), during which equity and commodity returns have typically turned negative. Therefore, we need to observe growth momentum over the next few months. This does not mean a transition is imminent in 2021, but we are increasingly concerned about the growth rates in H1 of 2022, with our systems pointing to a significant deceleration in GDP growth. This deceleration is particularly concerning given the level of optimism about economic growth in consensus expectations for 2022. Therefore, H1 2022 could be a situation where economic growth rates are weak but expected to be strong— a difficult environment for risk assets. We are still a ways off from 2022, but we think it’s important to be prepared well ahead of the next turning point. For the time being, growth rates remain positive (supporting cashflows) but decelerating (detracting/neutral for surprises).
Inflation: Stabilizing
Our Inflation Index is our high-frequency measure of the impulse to inflation from a wide range of comprehensive inflation data. Our Index Index aggregates data across measures of Spending, Expectations, and Commodities to give us an understanding of the degree and pervasiveness of inflation. Further, our Inflation Index allows us to nowcast inflation on an ongoing basis, giving us some insight into upcoming CPI prints:
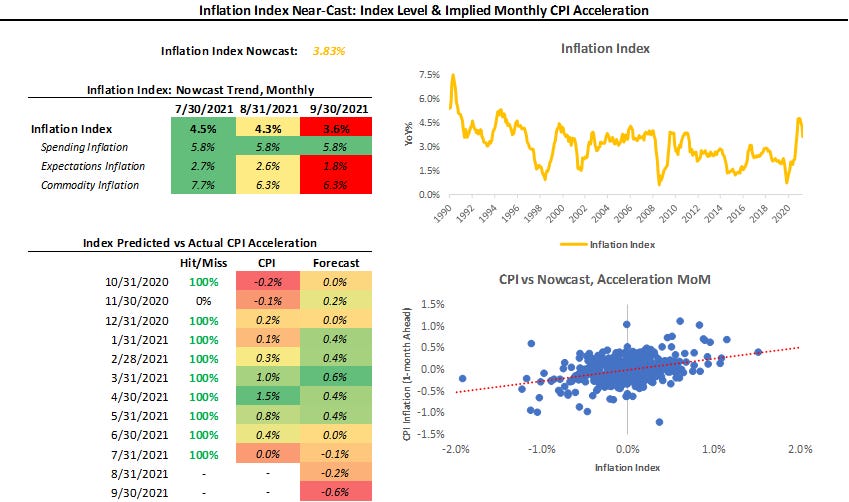
Our Inflation Index has been 58% accurate in determining the acceleration or deceleration of the next print in CPI since 1980. Over the last 12 months, the Inflation Index has had an 83% accuracy in estimating the monthly acceleration in CPI. However, the primary interpretation of our Inflation Index is to understand what the full spectrum of inflation data is telling about current inflationary forces. Since our last publication, our Inflation Index hasn’t moved meaningfully. Resultantly, our systematic CPI forecasts have not moved either:

Above, we show our systematic forecasts of CPI and its subcomponents. We include both a top-down estimate and a bottom-up estimate- obtained via forecasting each subcomponent. As we can see above, our top-down and bottom-up estimates concur about the future inflation trend- i.e., that we are at peak inflation levels. Our systematic forecasts use measures of trend and measures of cyclicality to estimate the future trend in inflation. The inflation trend has been strong recently, leading to an elevated forecast level, which we expect to subside, in line with our Inflation Index.
Liquidity: Concerns Growing
As part of our analytical framework, we assess the health of the countries’ income statement via growth and inflation and the health of its balance sheet via liquidity. Below, we show our Liquidity Monitor, where we show our measures of the Liquidity Impulse coming from Policy & the Private sector. Additionally, we show the normalized growth of some of the major subcomponents in the heatmap: (please note our Private Impulse is a beta version)

As we can see above, the decline in liquidity growth is broad-based across the sources of liquidity. While monetary policy continues to pump liquidity into the financial system, the slowdown in Treasury bill issuance creates a shortage of pristine collateral. Coincidently, forms of market finance- i.e., repo and money market funds, have been trending lower. This bodes ill for the markets, as these market finance instruments serve as funding sources for risk-taking. Further, the large cash balances created through fiscal policy injections have now started to leave cash balances and are finding their way into the real economy. To offer further insight into the liquidity picture below, we zoom in on our policy impulse measure of liquidity. Policy liquidity injections typically begin the financial cycle, and therefore lead risk premia, yield curves, and PE ratios by approximately 6-12 months:

The Policy Impulse Index typically rises to precede steepening yield curves and richening valuations. This is because the Policy Impulse Index measures pristine liquidity coming from monetary and fiscal authorities, which form the base of capital that can migrate to risk-taking and economic growth. As we can see above, our measures point to a declining liquidity impulse coming from monetary and fiscal injections, which means that the risk outlook is declining. This outlook worsens when we consider that the Federal Reserve could be tightening monetary policy around H1 2022, which would significantly tighten liquidity conditions. Overall, our liquidity outlook continues to deteriorate, forewarning a tougher environment on the horizon.
Market-Implied Regime: (+) G
Using the performance of various asset classes, we can extract what markets are implying which particular economic regime we are in. Below, we show what markets are telling us about the current growth and inflation regime:
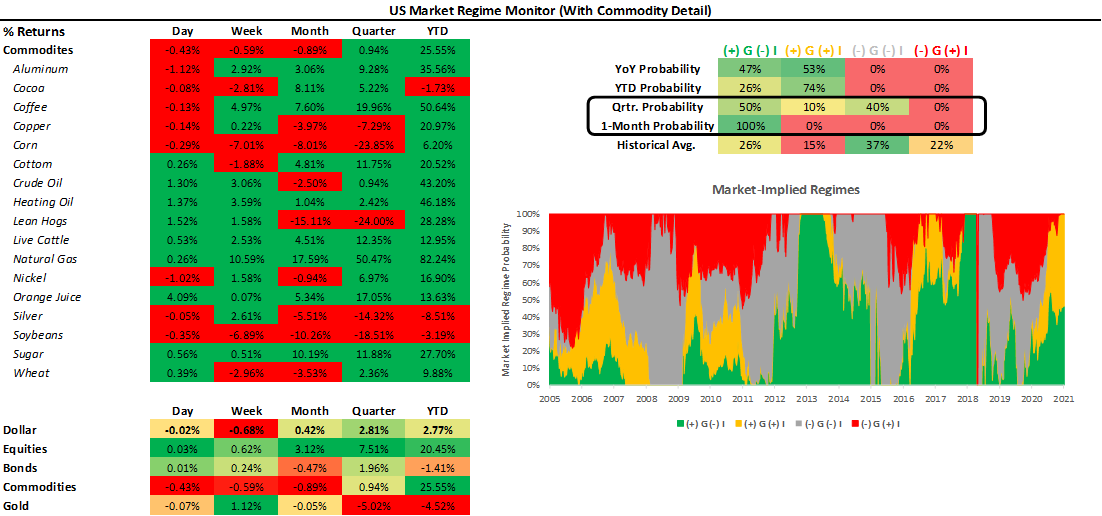
As we have mentioned before, we can be in one of four regimes:
(+) G (-) I: Rising Growth, Falling Inflation
(+) G (+) I: Rising Growth, Rising Inflation
(-) G (+) I: Falling Growth, Rising Inflation
(-) G (-) I: Falling Growth, Falling Inflation
Using our understanding of asset markets, we can classify periods of time into one of the four regimes mentioned above. Further, we can use the regime obtained from our market-implied odds with trend-following and cross-sectional momentum measures to create portfolio signals. To provide maximum accessibility, we truncate the portfolio construction into three stages:
Asset Class Selection: We create a portfolio that selects asset class exposure based on the current market-implied regime.
Sector Rotation: We create an equity rotation portfolio that chooses sectors based on their market-regime preference- to avoid overfitting, we choose these logically rather than based on our historical regime performance.
Unlevered Portfolio: We combine Asset Class Selection and Sector Rotation.
Market Regime Portfolio: Finally, we create our Market Regime Portfolio by ex-ante targeting equity volatility, i.e., we use leverage to match equity volatility.
Below, we show the results of this process versus major asset classes. Additionally, we show the performance characteristics over the decades since the 1970s:
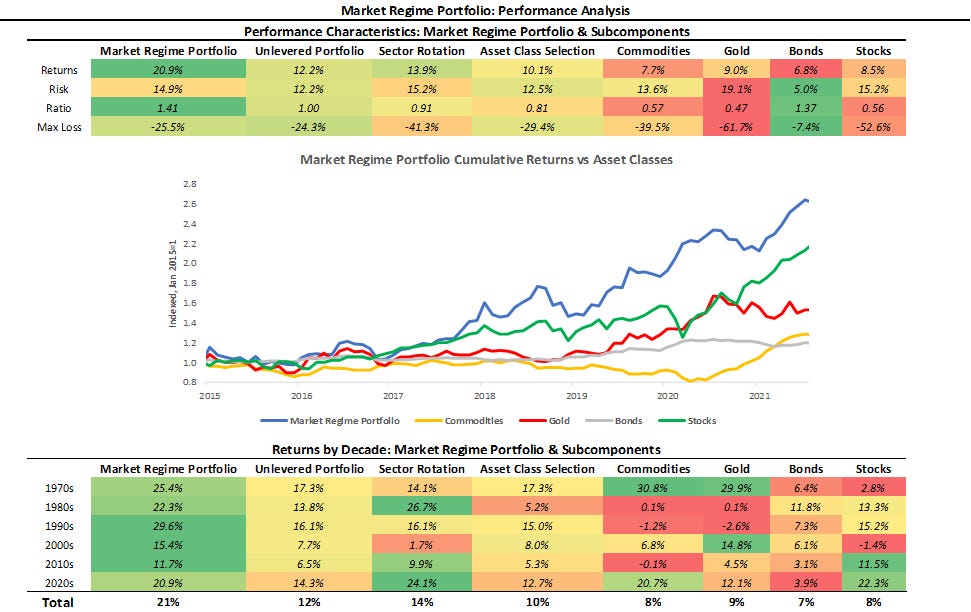
As we can see above, our systematic Market Regime Portfolio has a strong performance across measures and is consistent over time. The portfolio is designed to be decisive and aggressive, wholly allocating to assets that prefer the current regime, with no diversifying exposures. Therefore, we take a significant signal from our market-implied regime signal, which indicates we are in a (+) G environment, with (+) G (-) I and (+) G (+) I effectively tied, but with the latter marginally leading. Resultantly, the Market Regime Portfolio logged its first loss since January last month due to its aggressive allocation to commodities. This did not come as a surprise to us, as our systems have been pointing to a hand-off from commodities to equities for a while now:
However, the portfolio was designed to capture regime persistence; therefore, the portfolio continues to wait for signal confirmation. We think it is well worth considering transitioning exposure to US equities before signal confirmation for those more nimble in their exposures. This is because (+) G continues to be the dominant theme in markets, and therefore, we think there is a strong probability that (+) G (-) I will materialize as it has over the last month in strength.
Looking ahead of this immediate hand-off, we also see that our systems imply a (-) G (-) I environment in early 2022, consistent with our growth near-casting and leading-liquidity measures are telling us. Our systems seem to be aligning for a tough market environment in H1 2022.
Conclusions: A Tough H1 2022?
To reiterate the signals coming from our systems:
Economic growth rates are marginally lower but elevated, and our systems imply a continuation of this trend. This downtrend is bringing us closer to the lowest quartile of economic surprises, dimming the outlook. We see most cause for concern going into 2022, where growth expectations are elevated, and our systems imply significant deceleration.
Inflation remains elevated but subsiding. Our Inflation Index is largely unchanged and implying modestly lower CPI, and our systematic forecasts imply stagnating inflation rates.
Liquidity continues to deteriorate in a broad-based manner. Consistent with the liquidity transmission mechanism, this should imply weaker market conditions over the next 6-12 months. A taper by the Fed would exacerbate these moves.
Markets continue to price (+) G. Over the last month, we have seen strong (+) G (-) I price action, and we expect (+) G (-) I to become the dominant market regime shortly.
Overall, economic growth and inflation are still elevated but declining, and peak liquidity levels from last year fueled a strong (+) G (+) I environment, which remains the dominant market regime. Our systems continue to expect a transition to a (+) G (-) I market environment alongside a growing but slowing economy, a move that is arguably already in its early innings. Our Market Regime Portfolio remains biased to commodities, awaiting signal confirmation to switch to equities. For those more nimble, we think it makes sense to consider transitioning exposure ahead of signal confirmation.
Finally, our systems seem to be aligning on a confluence of macroeconomic events that could make H1 2022 a difficult environment. We’re still a ways off, but we will continue to keep you updated. Until next time.