

Cyclical Views

Today, we offer some brief updates on our economic and financial near-casts, given the high probability of a regime shift. As always, we focus on what the economic data tell us about the economy’s current state, what markets tell us about expectations, and our systematic near-casting framework telling us about the near-term. Our observations are as follows:
Growth & Inflation slowdowns are ahead. Our systematic forecasts tell us that both Growth & Inflation are highly likely to slow over the next three months. We stress-test these estimates to show that this is a highly probable outcome.
Liquidity will tighten further. Since last year, our liquidity tracking showed decelerations in the Liquidity Impulse (impacting markets and economies this year). The Federal Reserve’s quantitative tightening will further decrease liquidity, and the Treasury will play a significant role.
Markets are pricing rising inflation. Year to date, markets have priced (+) G (+) I, i.e., rising Growth and Inflation. However, there is likely to be a window of time during which Growth falls faster than Inflation, creating a window for (-) G (+) I, i.e., falling Growth and rising Inflation. The probability of risk-off regimes—(-) G or (-) L— are rising.
The future is dynamic, and our systems adjust as new information is available. Our bias is to allocate for the existing regime while trying to peek around the corner to what the future may hold. Our systems guided us to stay positive on risk assets through 2021 and have navigated the change in dynamics during 2022 well thus far, keeping us selectively long Commodities and short Equities. Looking to the next few months, our systematic forecasts for economic fundamentals tell us the environment will become even more challenging. We discuss this in the pages that follow.
Growth & Inflation Slowdowns
We track Growth & Inflation data daily via our GDP & Inflation Nowcasts, respectively. Further, we systematically use measures of trend and cyclicality to peek around the corner to tell us what the economic cycle holds in store. These systematic Growth & Inflation forecasts suggest significant decelerations ahead. We start by showing our estimates for future GDP Growth:
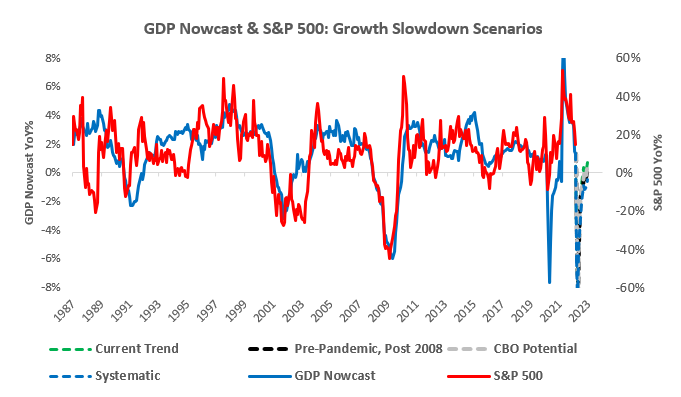
Above, we show our GDP Nowcast, along with a range of scenarios for future GDP growth. These scenarios are based on various degrees of underlying trend strength in Growth. Our systems estimate that the post-pandemic trend is currently at 1.25%, which is significantly lower than the CBO’s estimate of potential. Therefore, we stress-test this output by testing for various degrees of trend strength. However, as we can see above, the path is relatively consistent, regardless of the underlying trend in Growth. This slowdown is driven by cyclicality, which we capture via our Growth Impulse Index:
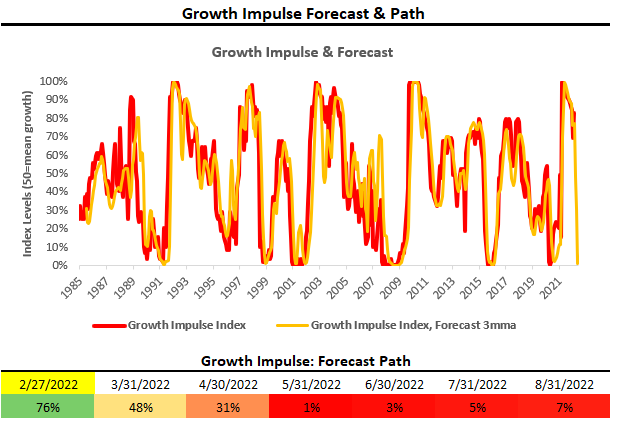
Our Growth Impulse Index strips away the underlying trend, better assessing where we are in the cycle and forming effective cyclical forecasts. As we can see above, our estimates show the deceleration in economic data beginning in earnest in March and then worsening in April.
Next, we turn to our estimates for future CPI Inflation:

Above, we show a range of scenarios for future CPI (we choose CPI, but the outlook is the same whether we use PCEor CPI). These scenarios are based on various degrees of underlying trend strength in inflation. Our systems estimate that the post-pandemic trend is currently at 2.55%. While this might sound low relative to recent prints, keep in mind this 70-basis points above the Pre-Pandemic, Post 2008 trend of 1.79% and 55-basis points above the Fed’s target of 2%. Nonetheless, to be consistent, we include the most recent trend of 6.9% to stress-test the path of systematic output. Once again, the path is relatively consistent, regardless of the underlying trend in inflation. We must note that even if the current Inflation trend sustains itself, it approaches 0 by year-end. Consistent with this, our Inflation Impulse Index shows the impulse deteriorating through 2022:

Our Inflation Impulse Index strips away the underlying trend, better assessing where we are in the cycle and forming effective cyclical forecasts. As we can see above, our estimates show the deceleration in CPI beginning in earnest in May and worsening in June.
Therefore, our systems judge that it is highly likely that both Growth & Inflation will decelerate over the next six months. However, the timing of these decelerations are not uniform between Growth & Inflation, creating a pocket of time where Growth slows, but inflation continues to look persistent.
Liquidity Tightens
The Federal Reserve has already moved towards tighter financial conditions, signaling to markets that they are likely to raise interest rates. Further, they are now on their path to Quantitative Tightening (QT), whereby they will reduce the Fed’s balance sheet size. The aggregate size of the Sovereigns balance sheet (monetary + fiscal) is a crucial determinant in providing liquidity to the economy and markets. As we have shown, the Liquidity Impulse from policy peaked last year, and with QT, it is likely to worsen significantly. We offer our Liquidity Monitor below:
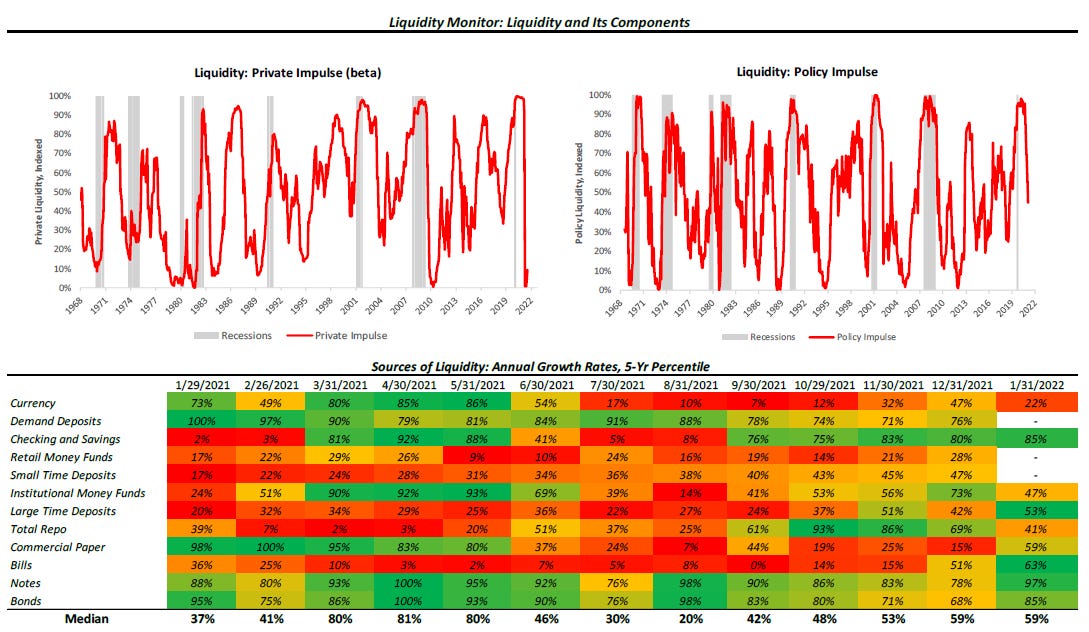
The Fed is on a path to QT. It will seek to reduce its Treasury holdings, reducing the proportion of reserve balances available to the private sector, thereby draining liquidity. A potential offset to this liquidity drain is the money in the Fed’s Reverse Repo Facility (RRP), mainly from Money Market Funds (MMFs). The only lever available to coax these cash balances from the Fed’s balance sheet is the new issuance of Treasury bills. Therefore, a crucial component of determining the severity of QT will be the actions of the US Treasury. The more Treasury bills issued in H2 of 2022, the less the drain on reserves. However, if the Treasury seeks to decrease the share of its bills, financial conditions will tighten further. We show the two extremes in potential outcomes this situation could create:
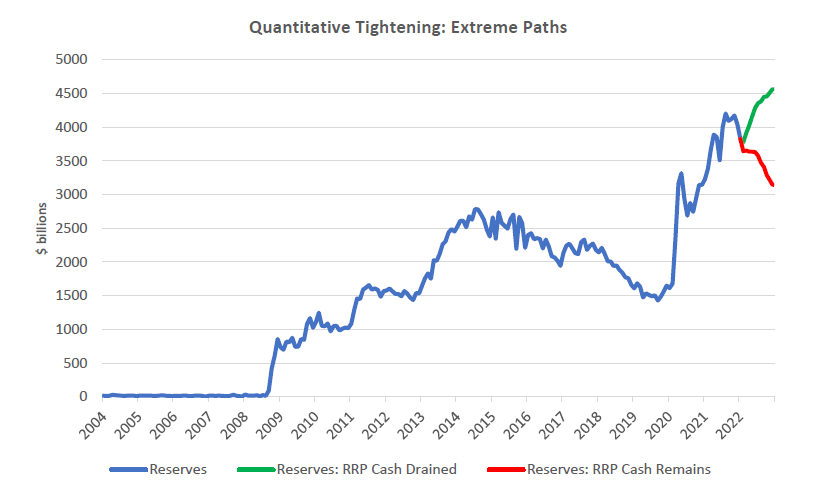
The above shows two extremes scenarios, and we estimate that reality is likely to be somewhere in between but skewed towards the scenarios where reserves decrease. There remains a significant amount that we don’t know about QT (timing & pace), along with the Treasuries’ corresponding actions. However, there is a high probability that aggregate sovereign balance sheet growth will deteriorate, coincident with worsening Growth and Inflation. This dynamic poses a headwind for risk assets, increasing market pricing odds indicative of tightening liquidity, i.e., cheaper equity market valuations, flatter yield curve, and higher credit spreads.
Markets Are Pricing Inflation
Using our understanding of asset markets, we can estimate the current trend in the market-implied regime in terms of Growth, Inflation, and Liquidity: Therefore, markets can price:
(+) G (-) I: Rising Growth & Falling Inflation
(+) G (+) I: Rising Growth & Rising Inflation
(-) G (-) I: Falling Growth & Falling Inflation
(-) G (+) I: Falling Growth & Rising Inflation
(-) L: Tightening Liquidity
Markets price these macroeconomic regimes with varying probabilities. We show our estimates for the current market regime below:
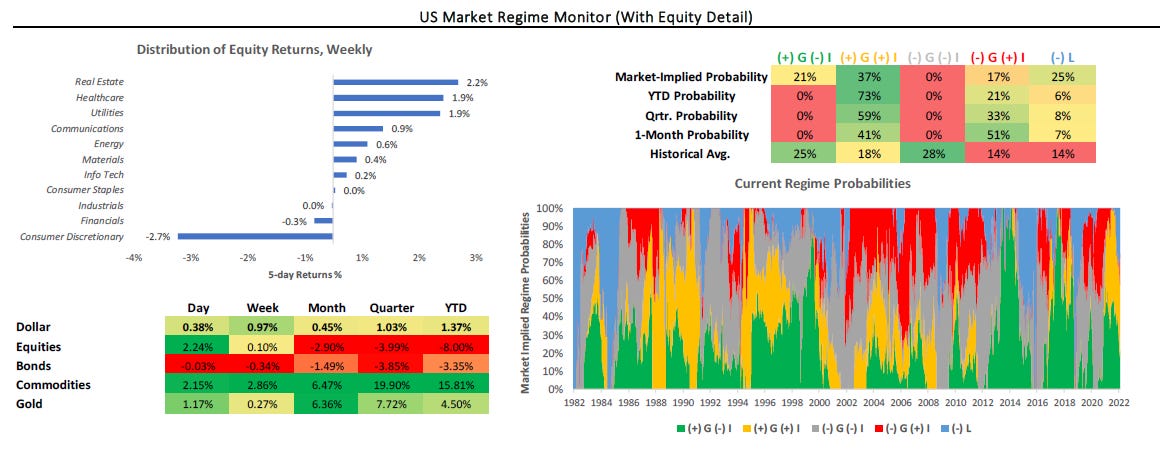
Markets have dominantly pricing (+) G (+) I on a year-to-date basis. However, the Growth bias of this pricing looks to be turning, suggesting (-) G could soon come into play. Additionally, markets have already begun to discount tightening liquidity conditions. The setup increasingly looks like a significant change to the landscape is underway, suggesting that equity markets could extend their weakness further. Commodities can perform well during (-) G (+) I periods, but an eventual transition to (-) G (-) I or (-) L would strangle them. Treasuries and fixed income remain a mixed bag, with strategically lucrative opportunities emerging, but tactical positioning dominates. Gold looks to be the bridge between (-) G (+) I and (-) G (-) I.
Conclusions
To reiterate our cylcial observations:
Growth & Inflation slowdowns are ahead.
Liquidity will tighten further.
Markets are pricing rising inflation.
This market remains one to be nimble in and to add and reduce exposure tactically. Check out The Observatory— our daily systematic research note which turns these views into actionable insights. Until next time.
well done, thoughtful data driven outline. thank you